

Polyubiquitin linkage profiles in three models of proteolytic stress suggest the etiology of Alzheimer disease
- PMID: 21278249
- PMCID: PMC3060499
- DOI: 10.1074/jbc.M110.149633
Polyubiquitin linkage profiles in three models of proteolytic stress suggest the etiology of Alzheimer disease
Abstract
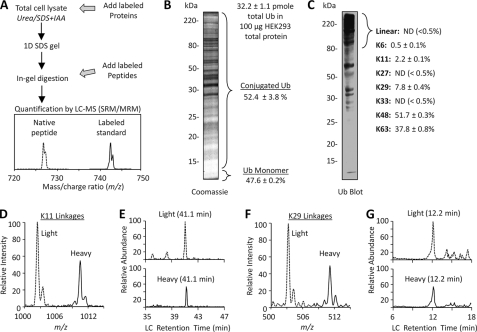
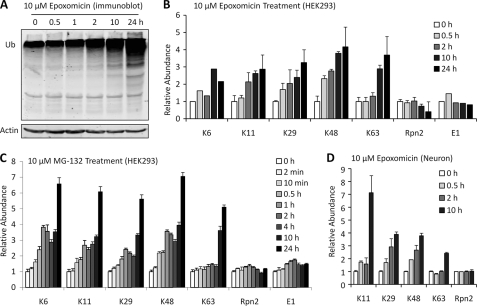
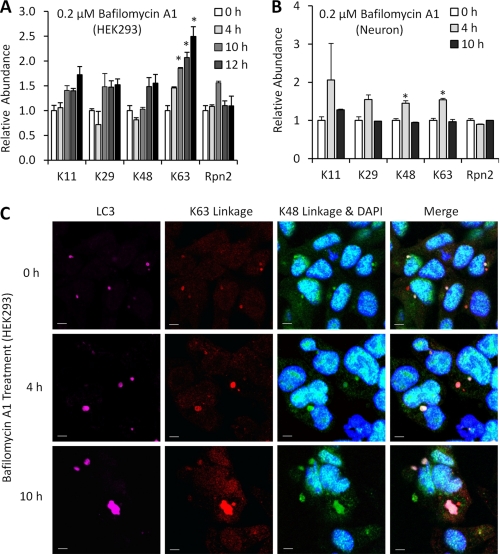
Polyubiquitin chains on substrates are assembled through any of seven lysine residues or the N terminus of ubiquitin (Ub), generating diverse linkages in the chain structure. PolyUb linkages regulate the fate of modified substrates, but their abundance and function in mammalian cells are not well studied. We present a mass spectrometry-based method to measure polyUb linkages directly from total lysate of mammalian cells. In HEK293 cells, the level of polyUb linkages was found to be 52% (Lys(48)), 38% (Lys(63)), 8% (Lys(29)), 2% (Lys(11)), and 0.5% or less for linear, Lys(6), Lys(27), and Lys(33) linkages. Tissue specificity of these linkages was examined in mice fully labeled by heavy stable isotopes (i.e. SILAC mice). Moreover, we profiled the Ub linkages in brain tissues from patients of Alzheimer disease with or without concurrent Lewy body disease as well as three cellular models of proteolytic stress: proteasome deficiency, lysosome deficiency, and heat shock. The data support that polyUb chains linked through Lys(6), Lys(11), Lys(27), Lys(29), and Lys(48) mediate proteasomal degradation, whereas Lys(63) chains are preferentially involved in the lysosomal pathway. Mixed linkages, including Lys(48), may also contribute to lysosomal targeting, as both Lys(63) and Lys(48) linkages are colocalized in LC3-labeled autophagosomes. Interestingly, heat shock treatment augments Lys(11), Lys(48), and Lys(63) but not Lys(29) linkages, and this unique pattern is similar to that in the profiled neurodegenerative cases. We conclude that different polyUb linkages play distinct roles under the three proteolytic stress conditions, and protein folding capacity in the heat shock responsive pathway might be more affected in Alzheimer disease.
Figures


Similar articles
-
Certain pairs of ubiquitin-conjugating enzymes (E2s) and ubiquitin-protein ligases (E3s) synthesize nondegradable forked ubiquitin chains containing all possible isopeptide linkages.J Biol Chem. 2007 Jun 15;282(24):17375-86. doi: 10.1074/jbc.M609659200. Epub 2007 Apr 10. J Biol Chem. 2007. PMID: 17426036
-
Analysis of the biochemical role of Lys-11 in polyubiquitin chain formation using quantitative mass spectrometry.Rapid Commun Mass Spectrom. 2013 Jan 30;27(2):339-46. doi: 10.1002/rcm.6447. Rapid Commun Mass Spectrom. 2013. PMID: 23239382
-
Disassembly of Lys11 and mixed linkage polyubiquitin conjugates provides insights into function of proteasomal deubiquitinases Rpn11 and Ubp6.J Biol Chem. 2015 Feb 20;290(8):4688-4704. doi: 10.1074/jbc.M114.568295. Epub 2014 Nov 11. J Biol Chem. 2015. PMID: 25389291 Free PMC article.
-
Emerging roles for Lys11-linked polyubiquitin in cellular regulation.Trends Biochem Sci. 2011 Jul;36(7):355-63. doi: 10.1016/j.tibs.2011.04.004. Epub 2011 Jun 7. Trends Biochem Sci. 2011. PMID: 21641804 Review.
-
The lysine48-based polyubiquitin chain proteasomal signal: not a single child anymore.Angew Chem Int Ed Engl. 2013 Jan 2;52(1):192-8. doi: 10.1002/anie.201205656. Epub 2012 Nov 4. Angew Chem Int Ed Engl. 2013. PMID: 23124625 Review.
Cited by
-
MITOL-dependent ubiquitylation negatively regulates the entry of PolγA into mitochondria.PLoS Biol. 2021 Mar 3;19(3):e3001139. doi: 10.1371/journal.pbio.3001139. eCollection 2021 Mar. PLoS Biol. 2021. PMID: 33657094 Free PMC article.
-
Why do cellular proteins linked to K63-polyubiquitin chains not associate with proteasomes?EMBO J. 2013 Feb 20;32(4):552-65. doi: 10.1038/emboj.2012.354. Epub 2013 Jan 11. EMBO J. 2013. PMID: 23314748 Free PMC article.
-
Structural Diversity of Ubiquitin E3 Ligase.Molecules. 2021 Nov 4;26(21):6682. doi: 10.3390/molecules26216682. Molecules. 2021. PMID: 34771091 Free PMC article. Review.
-
HIV-1 Nef Antagonizes SERINC5 Restriction by Downregulation of SERINC5 via the Endosome/Lysosome System.J Virol. 2018 May 14;92(11):e00196-18. doi: 10.1128/JVI.00196-18. Print 2018 Jun 1. J Virol. 2018. PMID: 29514909 Free PMC article.
-
DNA methyltransferase expression in triple-negative breast cancer predicts sensitivity to decitabine.J Clin Invest. 2018 Jun 1;128(6):2376-2388. doi: 10.1172/JCI97924. Epub 2018 Apr 30. J Clin Invest. 2018. PMID: 29708513 Free PMC article.
References
-
- Ciechanover A. (2005) Nat. Rev. Mol. Cell Biol. 6, 79–87 - PubMed
-
- Kerscher O., Felberbaum R., Hochstrasser M. (2006) Annu. Rev. Cell Dev. Biol. 22, 159–180 - PubMed
-
- Hicke L., Schubert H. L., Hill C. P. (2005) Nat. Rev. Mol. Cell Biol. 6, 610–621 - PubMed
-
- Peng J., Schwartz D., Elias J. E., Thoreen C. C., Cheng D., Marsischky G., Roelofs J., Finley D., Gygi S. P. (2003) Nat. Biotechnol. 21, 921–926 - PubMed
Publication types
MeSH terms
Substances
Grants and funding
LinkOut - more resources
Full Text Sources
Other Literature Sources
Medical
