. 2011 Mar 25;286(12):10803-13.
doi: 10.1074/jbc.M110.179739. Epub 2011 Jan 24.

AaCAT1 of the yellow fever mosquito, Aedes aegypti: a novel histidine-specific amino acid transporter from the SLC7 family

Affiliations

AaCAT1 of the yellow fever mosquito, Aedes aegypti: a novel histidine-specific amino acid transporter from the SLC7 family

Immo A Hansen et al. J Biol Chem. .

Abstract

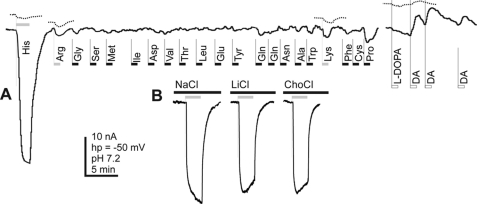
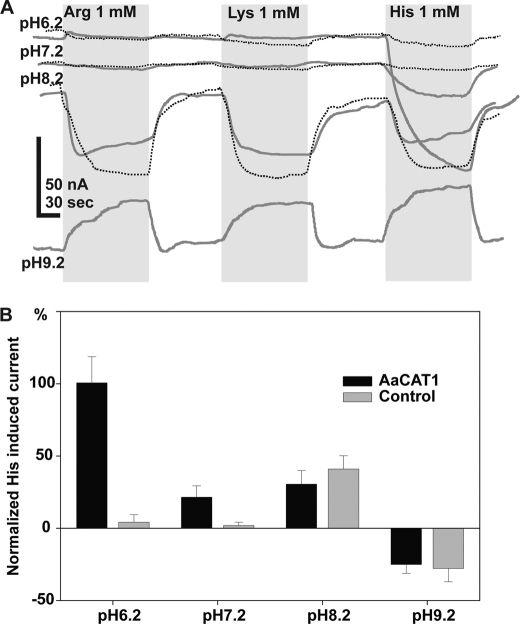
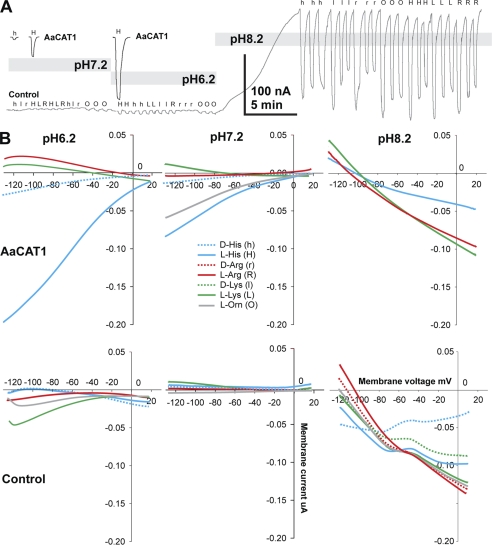
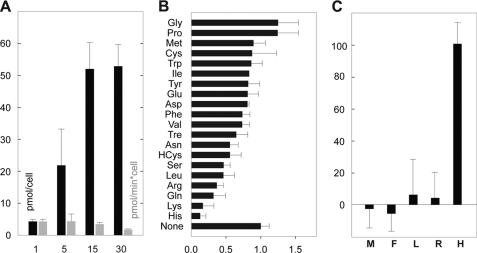
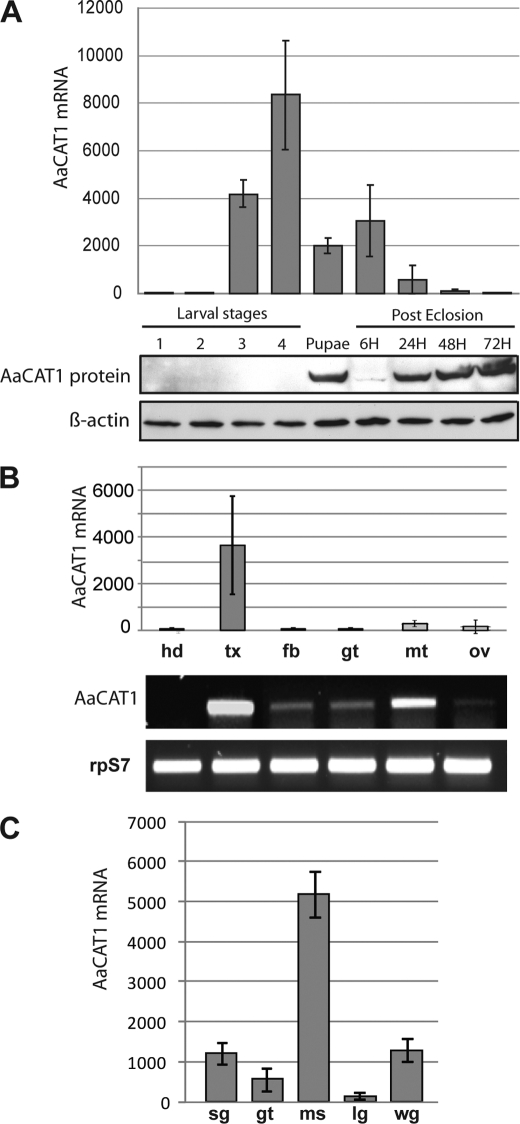
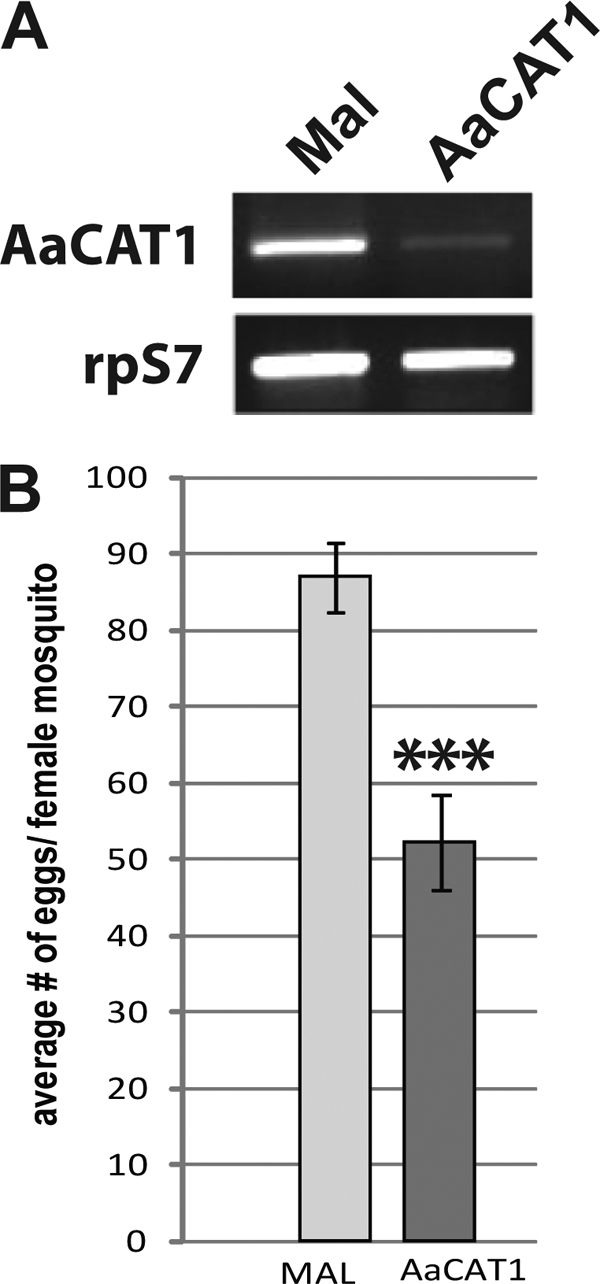
Insect yolk protein precursor gene expression is regulated by nutritional and endocrine signals. A surge of amino acids in the hemolymph of blood-fed female mosquitoes activates a nutrient signaling system in the fat bodies, which subsequently derepresses yolk protein precursor genes and makes them responsive to activation by steroid hormones. Orphan transporters of the SLC7 family were identified as essential upstream components of the nutrient signaling system in the fat body of fruit flies and the yellow fever mosquito, Aedes aegypti. However, the transport function of these proteins was unknown. We report expression and functional characterization of AaCAT1, cloned from the fat body of A. aegypti. Expression of AaCAT1 transcript and protein undergoes dynamic changes during postembryonic development of the mosquito. Transcript expression was especially high in the third and fourth larval stages; however, the AaCAT1 protein was detected only in pupa and adult stages. Functional expression and analysis of AaCAT1 in Xenopus oocytes revealed that it acts as a sodium-independent cationic amino acid transporter, with unique selectivity to L-histidine at neutral pH (K(0.5)(L-His) = 0.34 ± 0.07 mM, pH 7.2). Acidification to pH 6.2 dramatically increases AaCAT1-specific His(+)-induced current. RNAi-mediated silencing of AaCAT1 reduces egg yield of subsequent ovipositions. Our data show that AaCAT1 has notable differences in its transport mechanism when compared with related mammalian cationic amino acid transporters. It may execute histidine-specific transport and signaling in mosquito tissues.


Figures

FIGURE 1.
FIGURE 1.
Protein sequence/two-dimensional structure alignment of A. aegypti CAT1 with selected species-specific groups of the SLC7 family. A homologous protein structure (Protein Data Bank accession number 3GIA, ApcT from a thermophilic archaeon, Methanocaldococcus jannaschii) was used in the accurate protein sequence and structure alignments of SLC7 families groups from fruit fly D. melanogaster, mosquito A. aegypti, nematode Caenorabditis elegans, and mammalian representative Homo sapiens. Sequences are sorted according to a draft phylogenetic tree shown on the left side of the alignment. A gradually darker pattern represents higher sequence similarity. The alignment of the last two TMDs was manually improved, resulting in better pairwise sequence identity. The red arrows and green and blue blocks, respectively, depict conserved transmembrane domains and intracellular and extracellular helices, shown for ApcT and AaCAT1.
FIGURE 2.
FIGURE 2.
Phylogenetic tree of AaCAT1 and selected SLC7 transporters. The evolutionary history was inferred using the neighbor-joining method (34). The optimal tree with the sum of branch length = 25.84 is shown. The percentage of bootstrap test (10,000 replicates) is shown next to the branches (35). The tree is drawn using FigTree software to an approximately 3.7 billion-year-long scale with relative branch lengths used to infer the tree. The evolutionary distances were computed using the Poisson correction method (18) and are in units of the number of amino acid substitutions per site. The rate variation among sites was modeled with a γ distribution (shape parameter = 1). The analysis involved 48 amino acid sequences. All positions containing fewer than 95% alignment gaps and missing data were eliminated, leading to 445 positions in the final data set. Evolutionary analyses were conducted in MEGA4 (15).
FIGURE 3.
FIGURE 3.
Functional expression and ion dependence of AaCAT1 in Xenopus eggs. Oocytes were used 4–5 days after injection of iCAT1 mRNA. Control oocytes were injected with 40 nl of deionized water. A, current traces recorded during application of different substrates on a representative AaCAT1-expressing Xenopus laevis oocyte (solid line) and control uninjected oocyte (dotted line) are shown for selected canonical l-amino acids, DA, and dopamine precursor (L-DOPA)). All substrates were applied at constant flow rates switching between 98 mm Na+ (pH 7.2) solutions and an identical solution with the addition of 2 mm indicated substrates at −50 mV holding transmembrane voltage (two-electrode voltage clamp mode). B, 2 mm His-induced currents in an AaCAT1-expressing oocyte in 98 mm NaCl, 100 mm LiCl, and 100 mm choline-Cl solutions, respectively.
FIGURE 4.
FIGURE 4.
pH-dependent modulation of cationic amino acid-induced currents in AaCAT1-injected and control oocytes. Experimental and control oocytes were treated in identical conditions and recorded on the 5th day after injection of the experimental set. A, current trace during application of 1 mm l-Arg, l-Lys, and l-His at pH 6.2, 7.2, and 8.2 in AaCAT1-injected (solid line) and uninjected control oocytes (dotted lines) are shown. B, quantification of 1 mm l-His-induced currents at different pH values (bars are the normalized mean of current amplitudes ± S.D. (error bars) for n > 3 oocytes in each data point). The oocytes used were taken from different egg batches by three individual Xenopus females.
FIGURE 5.
FIGURE 5.
Voltage- and pH-dependent modulation of cationic amino acid-induced currents in AaCAT1 and control oocytes. A, a representative continuous recording of transmembrane currents in a control (uninjected) oocyte (gray line) during changes of pH in the perfusion medium (gray bars) and episodic applications of specific amino acids. The application events are indicated using the single-letter amino acid codes, with capital letters for l-amino acids, lowercase letters for d-amino acids, and O for l-ornithine. All substrates were applied at 1 mm concentration after dilution in 98 mm Na+ solution with specified pH values. The two-electrode voltage clamp mode with −50 mV holding voltage was used during all recordings. Signal was filtered using a digital 8-pole Bessel filter, and short high amplitude bursts of currents during rump stimulation were deleted from the recording. The solid black line shows selected fragments of a recording from an AaCAT1-injected oocyte at equivalent pH values. B, a collection of IV plots after application of selected basic amino acids. IVs for specific d- and l-amino acids are shown as dotted and solid lines, respectively, of different colors (middle). The panels summarize IVs from AaCAT1-expressing and uninjected oocytes (AaCAT1 and Control rows) at three different pH values (pH6.2, pH7.2, and pH8.2 columns). Data were acquired using episodic rump stimuli before application of specified amino acids and before washing. IV was built by point-by-point subtraction of the first current trace recording from the second, which resulted in the specific amino acid-induced component of the current.
FIGURE 6.
FIGURE 6.
Kinetic profile of l-His-induced currents in AaCAT1-injected oocytes. l-His-mediated currents were saturable (means ± S.E.; n > 3 extrapolated with a Hill solid gray line (half-maximum saturation E0.5l-His+ = 0.34 ± 0.07 mm; Hill constant η = 1.26 ± 0.2; n = 14) and Michaelis-Menten dotted line functions (K0.5l-His = 0.45 ± 0.17 mm; n = 14). The analysis was performed at pH 7.2. Considering possible selectivity of AaCAT1 to His+ cation and partial protonation of His under this condition (6.1%), the estimated values will be E0.5l-His+ = 20.7 ± 4 μm and K0.5l-His = 27.5 ± 10.37 μm.
FIGURE 7.
FIGURE 7.
AaCAT1-mediated uptake of isotope-labeled substrates in Xenopus oocytes. A, a time course of His uptake in AaCAT1-injected and uninjected control oocytes. Shown are total amount (black bars) (pmol/oocyte) and ratio (gray bars) (pmol/oocyte/min) of l-histidine uptake measured after 1, 5, 15, and 30 min in individual AaCAT1-injected oocytes incubated in 98 mm Na+ solution of 5 mm final concentration of l-His (1:100 l-[ring-2,5-3H]His/unlabeled l-His; bars show mean ± S.D. (error bars) for n ≥ 4 independent data points). After this experiment, 15 min was considered as the most appropriate linear uptake interval. B, a competitive amino acid-induced inhibition of radiolabeled histidine accumulation in the AaCAT1-expressing oocytes. The uptake of 1:100 stock radiolabeled l-His was measured in the presence of 5 mm concentration (except for 2.5 mm l-Tyr) of competing amino acids (bars represent mean ± S.D., n ≥ 3 for each specified inhibitor). The average counts in control oocytes exposed to the identical uptake conditions were subtracted before statistical evaluation. C, relative uptake of selected amino acids after a 15-min incubation of AaCAT1-expressing oocytes in a 1:100 98 mm Na+ solution of isotope-labeled amino acids. Nonspecific accumulation of radiolabeled substrates in uninjected oocytes was subtracted. All uptake experiments were performed at pH 7.2.
FIGURE 8.
FIGURE 8.
AaCAT1 is expressed in adult tissues and regulates reproduction. A, AaCAT1 developmental expression patterns. Top, relative AaCAT1 mRNA expression levels were determined via real-time PCR from samples isolated from total larvae, pupae, and adult mosquitoes. Data were normalized by real-time PCR analysis of ribosomal protein S7 mRNA levels in the cDNA samples. Values are means ± S.E. (error bars) of triplicate samples. Bottom, Western blot analysis of AaCAT1 protein. B, AaCAT1 organ/body part expression patterns. Top, relative AaCAT1 mRNA expression levels from different organs/tissues of female mosquitoes. Values are means ± S.E. of triplicate samples. Bottom, RT-PCR results; hd, head; tx, thorax; fb, fat body; gt, midgut; mt, Malpighian tubules; ov, ovaries. C, AaCAT1 thoracic tissue expression patterns. Shown are relative AaCAT1 mRNA expression patterns from different tissues isolated from the thorax. sg, salivary glands; gt, gut; ms, flight muscle; lg, legs; wg, wings.
FIGURE 9.
FIGURE 9.
AaCAT1 knockdown affects mosquito fecundity. A, RNAi-knockdown efficiency control. AaCAT1 mRNA expression levels were determined via RT-PCR in control and RNAi-knockdown mosquitoes. B, effect of AaCAT1 knockdown on egg numbers. dsRNA-injected mosquitoes were fed chicken blood. Fully engorged females were transferred in individual vials containing a wet cotton ball. Egg numbers were determined 96 h after the blood meal. Values are means ± S.E. (error bars) for 40 females. This experiment was repeated three times with similar results. Significance was determined using an unpaired Student's t test.

Similar articles

Cited by

References

    1. Attardo G. M., Hansen I. A., Raikhel A. S. (2005) Insect Biochem. Mol. Biol. 35, 661–675 - PubMed
    1. Arrese E. L., Soulages J. L. (2010) Annu. Rev. Entomol. 55, 207–225 - PMC - PubMed
    1. Baker K. D., Thummel C. S. (2007) Cell Metabolism 6, 257–266 - PMC - PubMed
    1. Hansen I. A., Attardo G. M., Park J. H., Peng Q., Raikhel A. S. (2004) Proc. Natl. Acad. Sci. U.S.A. 101, 10626–10631 - PMC - PubMed
    1. Hansen I. A., Attardo G. M., Roy S. G., Raikhel A. S. (2005) J. Biol. Chem. 280, 20565–20572 - PubMed

Publication types

LinkOut - more resources