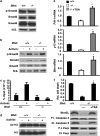
. 2011 Jun 2;30(22):2534-46.
doi: 10.1038/onc.2010.628. Epub 2011 Jan 24.

Loss of the Birt-Hogg-Dubé tumor suppressor results in apoptotic resistance due to aberrant TGFβ-mediated transcription

Affiliations
Free PMC article

Loss of the Birt-Hogg-Dubé tumor suppressor results in apoptotic resistance due to aberrant TGFβ-mediated transcription

T P Cash et al. Oncogene. .
Free PMC article

Abstract

Birt-Hogg-Dubé (BHD) syndrome is an inherited cancer susceptibility disease characterized by skin and kidney tumors, as well as cystic lung disease, which results from loss-of-function mutations in the BHD gene. BHD is also inactivated in a significant fraction of patients with sporadic renal cancers and idiopathic cystic lung disease, and little is known about its mode of action. To investigate the molecular and cellular basis of BHD tumor suppressor activity, we generated mutant Bhd mice and embryonic stem cell lines. BHD-deficient cells exhibited defects in cell-intrinsic apoptosis that correlated with reduced expression of the BH3-only protein Bim, which was similarly observed in all human and murine BHD-related tumors examined. We further demonstrate that Bim deficiency in Bhd(-/-) cells is not a consequence of elevated mTOR or ERK activity, but results instead from reduced Bim transcription associated with a general loss of TGFβ-mediated transcription and chromatin modifications. In aggregate, this work identifies a specific tumor suppressive mechanism for BHD in regulating TGFβ-dependent transcription and apoptosis, which has implications for the development of targeted therapies.


Figures
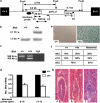
Figure 1
Figure 1
Bhdm/m embryos are early embryonic lethal. (a) Schematic depicting integration site of Bay Genomics pG2Lxf gene-trap vector in murine Bhd intron 8, location of probe and restriction sites for Southern blot genotyping and location of primers (P1, P2, and P3) for PCR-based genotyping. (b) Southern blot of PvuII-digested genomic DNA and (c) PCR-based genotypes of Bhd+/+ or Bhd+/m ES cells to discriminate wild-type from mutant alleles. ‘m' specifically designates the gene-trapped mutant Bhd allele from Bay Genomics throughout the manuscript. (d) Relative Bhd mRNA levels in Bhd+/+ versus Bhd+/m ES cells assayed by qRT–PCR using primers spanning exons just downstream of the trap cassette (exons 9–10) or across the terminal exons of the Bhd gene (exons 12–13), ruling out the presence of aberrant transcripts generated from cryptic transcriptional start sites downstream of the trap cassette. (e) X-Gal staining of Bhd+/+ and Bhd+/m ES cells showing Bhd+/m cells express the Bhd-β-galactosidase fusion product. (f) Table of progeny obtained from Bhd+/m intercrosses showing no Bhd−/− embryos could be recovered after e6.5. (g) 200 × images of H&E-stained cross-sections of paraffin-embedded e6.5 embryos from Bhd+/m intercrosses. (A) Exemplifies normal morphology while (B) and (C) demonstrate gross abnormalities, probable Bhdm/m genotypes.
Figure 2
Figure 2
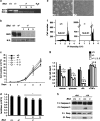
Bhd−/− ES cells do not have a proliferative or growth advantage, but are resistant to apoptosis. (a) PCR genotypes verifying loss of wild-type Bhd allele in three independent ES clones, designated as ‘1', ‘2', and ‘3,' after step-up selection. WT=wild-type, Mut=mutant alleles. (b) Western blot demonstrating loss of BHD protein expression in three independent Bhd−/− ES clones with a non-specific (NS) band shown as a loading control. (c) Growth curve showing Bhd−/− ES cells proliferate at similar rates to Bhd+/+ and Bhd+/− counterparts, but have increased saturation density at day 4. (d) Coulter counter size measurements showing Bhd−/− cells are significantly smaller than Bhd+/+ and Bhd+/− ES cells (*P=0.000623). Bhd−/− ES cells are resistant to stress-induced apoptosis as shown by (e) brightfield images of Bhd+/+ and Bhd−/− ES cells starved of amino acids for 1 day, or (g) FACs analysis of cells containing sub-G1 DNA content after 1 day serum, glucose and amino-acid (AA) deprivation compared with Bhd+/+ and Bhd+/− cells (*P<0.0000345), but not by Tumor necrosis factor α treatment. (f) Representative FACs plot showing Bhd−/− ES cells have significantly less sub-G1 DNA content following 1 day of amino-acid starvation. (h) Western blot of Caspase and Parp cleavage with and without amino-acid starvation in Bhd+/+ and Bhd−/− ES cells. All bar graphs represent averages of three independent experiments with error bars showing standard error of the mean (s.e.m.).
Figure 3
Figure 3
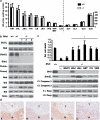
Death resistance of Bhd−/− cells is not due to increased intracellular amino-acid levels, but instead results from decreased Bim protein levels. (a) Intracellular amino-acid levels normalized to total protein in Bhd+/+ versus Bhd−/− ES cells as assessed by HPLC. Data represent average of three independent experiments and error bars reflect standard deviation. (b) Western blot showing Bhd−/− ES cells have decreased levels of several BH3-only proteins, most notably Bim. (c) Quantification of sub-G1 populations by flow cytometry in upper panel shows restoration of Bhd and BimEL expression, or treatment with ABT-737 (ABT), chloroquine (CQ) or 3-methyl-adenine (3MA) rescues the death-resistance phenotype of Bhd−/− ES cells in response to 2-day amino-acid starvation compared with untreated or vector only (MSCV) infected controls. Bar graph represents three independent experiments and error bars show s.e.m. Lower panel is a western blot verifying re-expression of BHD and Bim, and correlate changes in Caspase-3 and Parp cleavage. (d) 200 × images of paraffin-embedded sections of solid renal tumors (labeled T) from Bhd+/m mice 18–21 months in age (AC) or a human patient (D) exhibiting loss of Bim expression compared with normal adjacent tissue (labeled N). (AC) Hybrid clear cell-oncocytic lesions from aged Bhd+/m mice and (D) is a human chromophobe RCC.
Figure 4
Figure 4
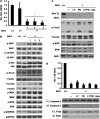
Bim is transcriptionally downregulated in Bhd−/− cells independent of mTORC1, mTORC2, or ERK hyperactivation. (a) qRT–PCR analysis showing Bim mRNA is reduced in Bhd−/− ES cells (*P=1.44 × 10⁻⁷). (b) Western blot demonstrating that mTORC1 (indicated by p-S6K1 [T389] and p-4E-BP1 [T70]), mTORC2 (indicated by p-Akt [S473] and p-FoxO [FoxO1 (Thr24]/FoxO3a [Thr32]/Fox04 [Thr28]) and ERK (indicated by p-MEK [S217/271], p-ERK [T202/Y204], and p-p90RSK [T359/S363]) signaling pathways are hyperactivated in Bhd−/− ES cells. (c) Inhibition of hyperactivated mTORC2 by 5 μ LY294002 (LY) or ERK by 10 μ PD98059 (PD) or a combination of both, or inhibition of mTORC1 by 20 n rapamycin (rapa) for 24 h does not restore Bim protein expression levels in Bhd−/− cells by western blot. Drug efficacy was shown by decreased p-FOXO levels with LY treatment and decreased p-ERK levels with PD treatment in Bhd−/− cells. Decreased mobility shifts in S6K demonstrate effectiveness of both LY and rapa treatments. Doses were chosen based on their ability to bring activation levels of signaling components in Bhd−/− cells to those observed in Bhd+/+ cells. (d) Bhd−/− ES cells were pre-treated for 6 h with the same panel of inhibitors as (c), then starved of amino acids for 2 days with inhibitors re-added after 1 day of starvation to maintain concentrations. Death was assessed by quantification of sub-G1 populations by flow cytometry (upper panel, *P<0.0345) and Caspase and Parp cleavage by western blot (lower panel). All bar graphs in this figure represent averages of three independent experiments with error bars reflecting s.e.m.
Figure 5
Figure 5
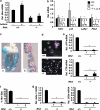
Bhd−/− ES cells exhibit phenotypes and transcriptional defects characteristic of TGFβ-signaling components. (a) Bhd+/+ and Bhd−/− ES cells were cultured for 24 h in N2B27 media, then stimulated with 10 ng/ml of Activin. Bim mRNA levels were significantly induced in Bhd+/+ cells after stimulation, but not in Bhd−/− ES cells (*P=0.00864). (b) qRT–PCR analysis showing canonical TGFβ target genes PAI-1, p15, Lefty1, and Pitx2 are significantly downregulated in multiple Bhd−/− ES cell clones labeled 1, 2 and 3 (*P<0.04). (c) X-gal stained 70 × image of (a) whole mount or 200 × image of (b) sectioned yolk sac taken from a e10.5 Bhd+/m embryo exhibiting high Bhd expression in visceral endoderm of the yolk sac. (d) 200 × image of day 12 EBs showing Bhd+/+ EBs form expanded cystic structures reminiscent of yolk sacs while Bhd−/− EBs fail to do so. (e) qRT–PCR analysis on RNA from EBs, showing two independent Bhd−/− EBs (clones 1 and 2) fail to express maximal levels of mature yolk sac markers α-feto-protein (Afp) and Trithioredoxin (Ttr). Averages represent maximal expression levels for each mRNA, which occurred between days 6 and 9 of EB development (*P<1.0 × 10⁻⁵ for both mRNAs). (f) Quantification of benzediene-positive EBs that express hemoglobin (Hb) at day 10 in methylcellulose cultures demonstrating Bhd−/− EBs fail to form erythroid lineages (*P=2.32 × 10⁻⁶). Data represent the average of three independent experiments with error bars showing standard deviation. (g) qRT–PCR analysis of Gata-1 and CD34 mRNA expression in day 10 EBs in methylcellulose cultures, which is significantly reduced in Bhd−/− EBs (P<4.49 × 10⁻⁶).
Figure 6
Figure 6
Loss of BHD results in HDAC-mediated silencing of TGFβ-transcriptional targets. Western blot of nuclear extracts showing (a) basal or (b) Activin-induced levels of nuclear phospho-smad2, Smad2, and Smad4 are unaffected in Bhd−/− ES cells. Non-specific (NS) band is shown as a loading control. (c) qRT–PCR using primers located in the Lefty1 promoter on genomic DNA immunoprecipitated with acetyl-histone H3 antibody from ES cells stimulated with activin for 1 h following 24 h culture in N2B27. (d) Western blot showing total levels of acetyl-histone H3 are unaffected in Bhd+/+ versus Bhd−/− cells with and without Activin treatment. (e) Treatment of Bhd−/− cells with TSA restores mRNA levels of PAI-1, p15, and Bim as shown by qRT–PCR analysis of mRNA expression levels (*P<0.0362). (f) Treatment of Bhd−/− ES cells with TSA rescues the Bhd−/− cellular death-resistance phenotype and Bim expression as shown by analysis of sub-G1 populations (above, *P=0.000145) and western blot for Bim, and Caspase and Parp cleavage (below).
Figure 7
Figure 7
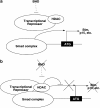
Model: Loss of BHD leads to increased HDAC-dependent repression of Smad-specific promoters. (a) In the presence of BHD, Smad-dependent transcription is active, allowing transcription of pro-apoptotic genes like Bim and anti-proliferative genes like p15 to promote tumor suppression. (b) However, when BHD is lost, Smad-dependent transcription is repressed and apoptotic and anti-proliferative responses are lost, leading to tumor formation.

Similar articles

Cited by

References

    1. Adelman DM, Maltepe E, Simon MC. Multilineage embryonic hematopoiesis requires hypoxic ARNT activity. Genes Dev. 1999;13:2478–2483. - PMC - PubMed
    1. Baba M, Furihata M, Hong SB, Tessarollo L, Haines DC, Southon E, et al. Kidney-targeted Birt-Hogg-Dube gene inactivation in a mouse model: Erk1/2 and Akt-mTOR activation, cell hyperproliferation, and polycystic kidneys. J Natl Cancer Inst. 2008;100:140–154. - PMC - PubMed
    1. Baba M, Hong SB, Sharma N, Warren MB, Nickerson ML, Iwamatsu A, et al. Folliculin encoded by the BHD gene interacts with a binding protein, FNIP1, and AMPK, and is involved in AMPK and mTOR signaling. Proc Natl Acad Sci USA. 2006;103:15552–15557. - PMC - PubMed
    1. Cooper MC, Levy J, Cantor LN, Marks PA, Rifkind RA. The effect of erythropoietin on colonial growth of erythroid precursor cells in vitro. Proc Natl Acad Sci USA. 1974;71:1677–1680. - PMC - PubMed
    1. Covello KL, Kehler J, Yu H, Gordan JD, Arsham AM, Hu CJ, et al. HIF-2alpha regulates Oct-4: effects of hypoxia on stem cell function, embryonic development, and tumor growth. Genes Dev. 2006;20:557–570. - PMC - PubMed

Publication types

MeSH terms