Enteric dysbiosis associated with a mouse model of alcoholic liver disease
- PMID: 21254165
- PMCID: PMC3059122
- DOI: 10.1002/hep.24018
Enteric dysbiosis associated with a mouse model of alcoholic liver disease
Abstract
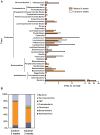
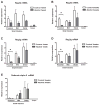
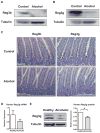
The translocation of bacteria and bacterial products into the circulation contributes to alcoholic liver disease. Intestinal bacterial overgrowth is common in patients with alcoholic liver disease. The aims of our study were to investigate bacterial translocation, changes in the enteric microbiome, and its regulation by mucosal antimicrobial proteins in alcoholic liver disease. We used a mouse model of continuous intragastric feeding of alcohol or an isocaloric diet. Bacterial translocation occurred prior to changes observed in the microbiome. Quantitative changes in the intestinal microflora of these animals were assessed first using conventional culture techniques in the small and large intestine. Although we found no difference after 1 day or 1 week, intestinal bacterial overgrowth was observed in the gastrointestinal tract of mice fed alcohol for 3 weeks compared with control mice fed an isocaloric liquid diet. Because <20% of all gastrointestinal bacteria can be cultured using conventional methodologies, we performed massively parallel pyrosequencing to further assess the qualitative changes in the intestinal microbiome following alcohol exposure. Sequencing of 16S ribosomal RNA genes revealed a relative abundance of Bacteroidetes and Verrucomicrobia bacteria in mice fed alcohol compared with a relative predominance of Firmicutes bacteria in control mice. With respect to the host's transcriptome, alcohol feeding was associated with down-regulation in gene and protein expression of bactericidal c-type lectins Reg3b and Reg3g in the small intestine. Treatment with prebiotics partially restored Reg3g protein levels, reduced bacterial overgrowth, and lessened alcoholic steatohepatitis.
Conclusion: Alcohol feeding is associated with intestinal bacterial overgrowth and enteric dysbiosis. Intestinal antimicrobial molecules are dysregulated following chronic alcohol feeding contributing to changes in the enteric microbiome and to alcoholic steatohepatitis.
Copyright © 2010 American Association for the Study of Liver Diseases.
Figures


Similar articles
-
Supplementation of saturated long-chain fatty acids maintains intestinal eubiosis and reduces ethanol-induced liver injury in mice.Gastroenterology. 2015 Jan;148(1):203-214.e16. doi: 10.1053/j.gastro.2014.09.014. Epub 2014 Sep 16. Gastroenterology. 2015. PMID: 25239591 Free PMC article.
-
Deficiency of intestinal mucin-2 ameliorates experimental alcoholic liver disease in mice.Hepatology. 2013 Jul;58(1):108-19. doi: 10.1002/hep.26321. Epub 2013 May 27. Hepatology. 2013. PMID: 23408358 Free PMC article.
-
Bacteria engineered to produce IL-22 in intestine induce expression of REG3G to reduce ethanol-induced liver disease in mice.Gut. 2019 Aug;68(8):1504-1515. doi: 10.1136/gutjnl-2018-317232. Epub 2018 Nov 17. Gut. 2019. PMID: 30448775 Free PMC article.
-
Host-microbiome interactions in alcoholic liver disease.Gut Liver. 2014 May;8(3):237-41. doi: 10.5009/gnl.2014.8.3.237. Gut Liver. 2014. PMID: 24827618 Free PMC article. Review.
-
Alcoholic liver disease: the gut microbiome and liver cross talk.Alcohol Clin Exp Res. 2015 May;39(5):763-75. doi: 10.1111/acer.12704. Alcohol Clin Exp Res. 2015. PMID: 25872593 Free PMC article. Review.
Cited by
-
Microbial translocation in chronic liver diseases.Int J Microbiol. 2012;2012:694629. doi: 10.1155/2012/694629. Epub 2012 Jul 17. Int J Microbiol. 2012. PMID: 22848224 Free PMC article.
-
Alcohol induced alterations to the human fecal VOC metabolome.PLoS One. 2015 Mar 9;10(3):e0119362. doi: 10.1371/journal.pone.0119362. eCollection 2015. PLoS One. 2015. PMID: 25751150 Free PMC article.
-
Immune Response to an Acute Moderate Dose of Alcohol in Healthy Young Adults.Alcohol Alcohol. 2020 Oct 20;55(6):616-623. doi: 10.1093/alcalc/agaa079. Alcohol Alcohol. 2020. PMID: 32776108 Free PMC article.
-
Impact of alcohol-induced intestinal microbiota dysbiosis in a rodent model of Alzheimer's disease.Front Aging. 2022 Aug 15;3:916336. doi: 10.3389/fragi.2022.916336. eCollection 2022. Front Aging. 2022. PMID: 36046496 Free PMC article.
-
Translational Approaches with Antioxidant Phytochemicals against Alcohol-Mediated Oxidative Stress, Gut Dysbiosis, Intestinal Barrier Dysfunction, and Fatty Liver Disease.Antioxidants (Basel). 2021 Mar 4;10(3):384. doi: 10.3390/antiox10030384. Antioxidants (Basel). 2021. PMID: 33806556 Free PMC article. Review.
References
-
- Bode C, Bode JC. Activation of the innate immune system and alcoholic liver disease: effects of ethanol per se or enhanced intestinal translocation of bacterial toxins induced by ethanol? Alcohol Clin Exp Res. 2005;29:166S–171S. - PubMed
-
- Brann OS. Infectious complications of cirrhosis. Curr Gastroenterol Rep. 2001;3:285–292. - PubMed
-
- Christou L, Pappas G, Falagas ME. Bacterial infection-related morbidity and mortality in cirrhosis. Am J Gastroenterol. 2007;102:1510–1517. - PubMed
Publication types
MeSH terms
Substances
Grants and funding
LinkOut - more resources
Full Text Sources
Other Literature Sources
