

Global transcriptome analysis of human bone marrow stromal cells (BMSC) reveals proliferative, mobile and interactive cells that produce abundant extracellular matrix proteins, some of which may affect BMSC potency
- PMID: 21250865
- PMCID: PMC3389819
- DOI: 10.3109/14653249.2010.548379
Global transcriptome analysis of human bone marrow stromal cells (BMSC) reveals proliferative, mobile and interactive cells that produce abundant extracellular matrix proteins, some of which may affect BMSC potency
Abstract
Background aims: Bone marrow stromal cells (BMSC) are being used for immune modulatory, anti-inflammatory and tissue engineering applications, but the properties responsible for these effects are not completely understood. Human BMSC were characterized to identify factors that might be responsible for their clinical effects and biomarkers for assessing their quality.
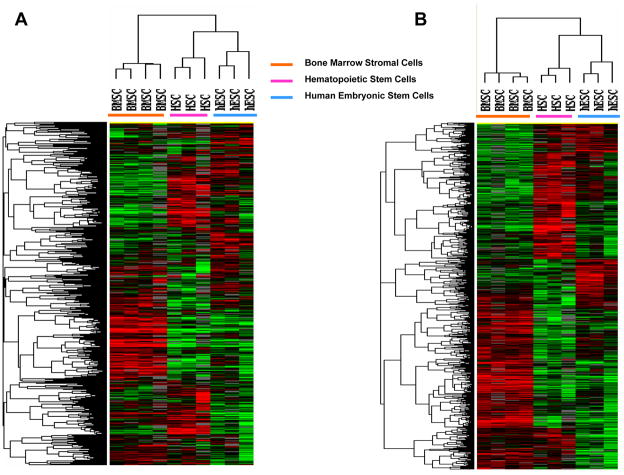
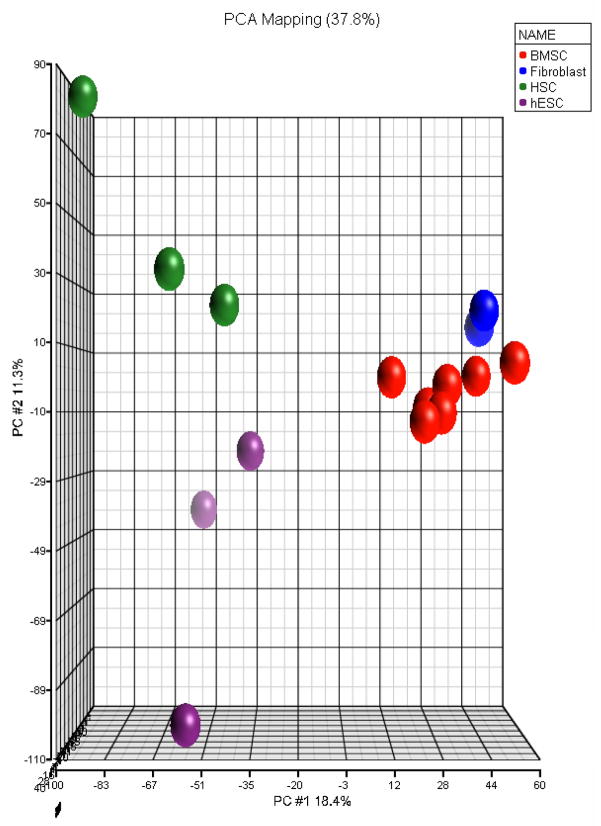
Methods: Early passage BMSC prepared from marrow aspirates of seven healthy subjects were compared with three human embryonic stem cell (hESC) samples, CD34(+) cells from three healthy subjects and three fibroblast cell lines. The cells were analyzed with oligonucleotide expression microarrays with more than 35 000 probes.
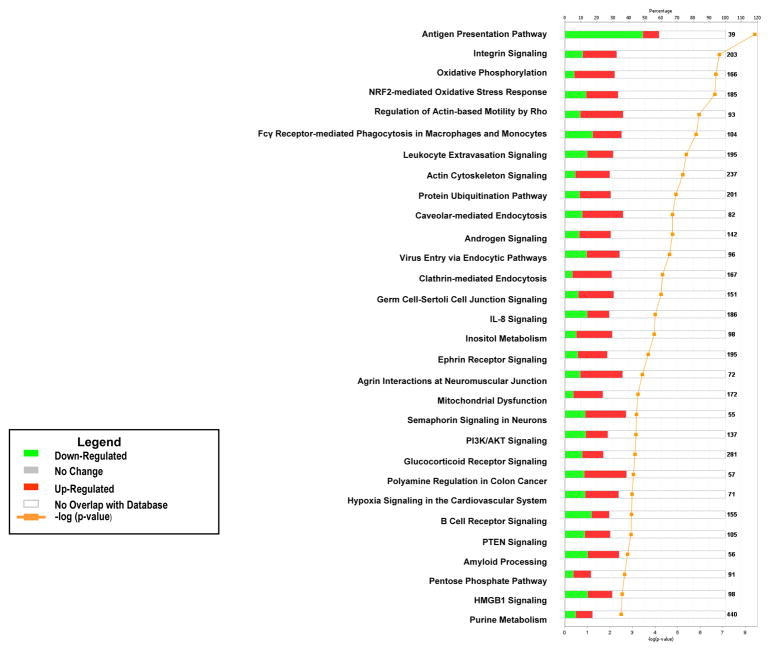
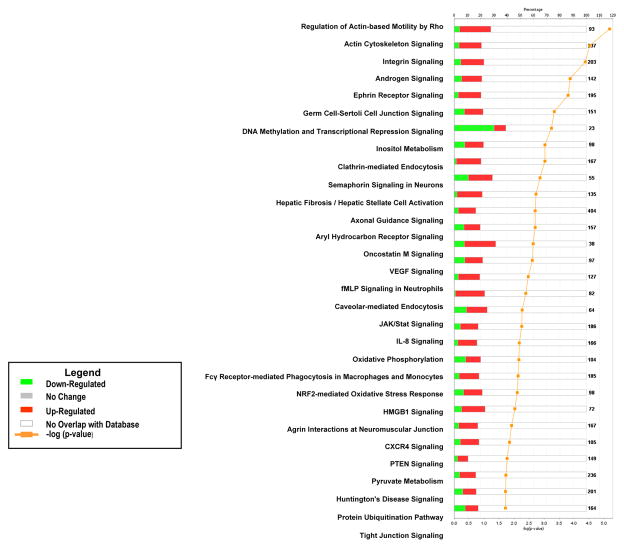
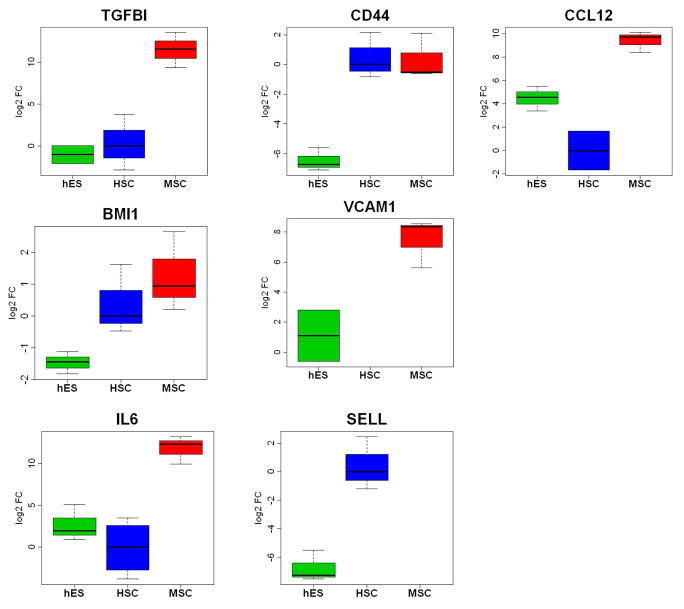
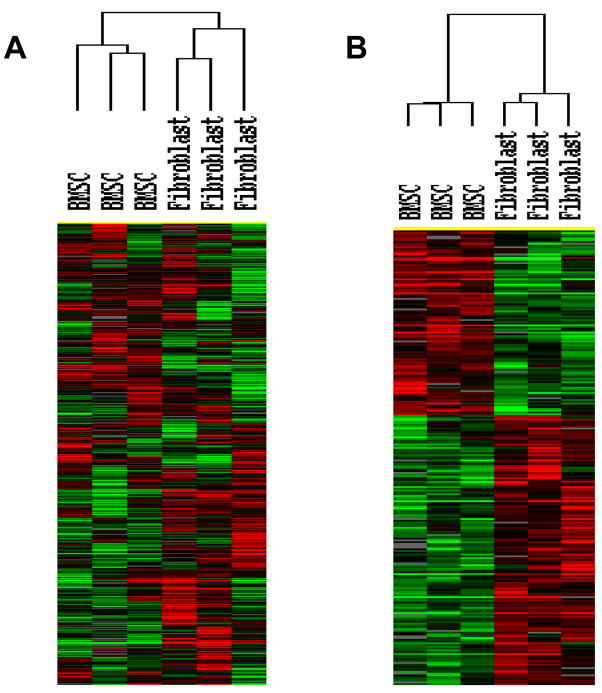
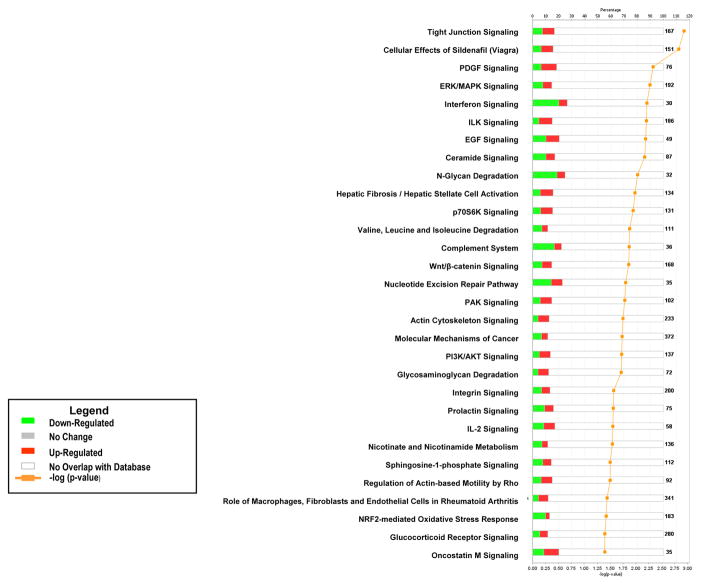
Results: BMSC gene expression signatures of BMSC differed from those of hematopoietic stem cells (HSC), hESC and fibroblasts. Genes upregulated in BMSC were involved with cell movement, cell-to-cell signaling and interaction and proliferation. The upregulated genes most probably belonged to pathways for integrin signaling, integrin-linked kinase (ILK) signaling, NF-E2-related factor-2 (NFR2)-mediated oxidative stress response, regulation of actin-based motility by Rho, actin cytoskeletal signaling, caveolar-mediated endocytosis, clathrin-mediated endocytosis and Wingless-type MMTV integration site (Wnt/β catenin signaling. Among the most highly upregulated genes were structural extracellular matrix (ECM) proteins (α5 and β5 integrin chains, fibronectin and collagen type IIIα1 and Vα1) and functional EMC proteins [connective tissue growth factor (CTGF), transforming growth factor beta-induced protein (TGFBI) and A disintegrin and metalloproteinase (ADAM12)].
Conclusions: Global analysis of human BMSC suggests that they are mobile, metabolically active, proliferative and interactive cells that make use of integrins and integrin signaling. They produce abundant ECM proteins that may contribute to their clinical immune modulatory and anti-inflammatory effects.
Figures
Comment in
-
The best bone marrow stromal cell for therapy is … 'yellow'.Cytotherapy. 2011 Jul;13(6):644-6. doi: 10.3109/14653249.2011.585063. Epub 2011 May 10. Cytotherapy. 2011. PMID: 21554177 No abstract available.
Similar articles
-
Osteoblasts and bone marrow mesenchymal stromal cells control hematopoietic stem cell migration and proliferation in 3D in vitro model.PLoS One. 2010 Feb 8;5(2):e9093. doi: 10.1371/journal.pone.0009093. PLoS One. 2010. PMID: 20161704 Free PMC article.
-
Involvement of TGF-{beta} receptor- and integrin-mediated signaling pathways in the pathogenesis of granular corneal dystrophy II.Invest Ophthalmol Vis Sci. 2010 Apr;51(4):1832-47. doi: 10.1167/iovs.09-4149. Epub 2009 Nov 20. Invest Ophthalmol Vis Sci. 2010. PMID: 19933198
-
TGFBI Expressed by Bone Marrow Niche Cells and Hematopoietic Stem and Progenitor Cells Regulates Hematopoiesis.Stem Cells Dev. 2018 Nov 1;27(21):1494-1506. doi: 10.1089/scd.2018.0124. Epub 2018 Sep 6. Stem Cells Dev. 2018. PMID: 30084753 Free PMC article.
-
Expression and function of integrins on hematopoietic progenitor cells.Acta Haematol. 1997;97(1-2):13-21. doi: 10.1159/000203655. Acta Haematol. 1997. PMID: 8980606 Review.
-
[Research Advances on the Role of Bone Marrow Stromal Cell in Acute Lymphoblastic Leukemia --Review].Zhongguo Shi Yan Xue Ye Xue Za Zhi. 2022 Feb;30(1):319-322. doi: 10.19746/j.cnki.issn.1009-2137.2022.01.053. Zhongguo Shi Yan Xue Ye Xue Za Zhi. 2022. PMID: 35123647 Review. Chinese.
Cited by
-
Direct T cell-tumour interaction triggers TH1 phenotype activation through the modification of the mesenchymal stromal cells transcriptional programme.Br J Cancer. 2014 Jun 10;110(12):2955-64. doi: 10.1038/bjc.2014.235. Epub 2014 May 8. Br J Cancer. 2014. PMID: 24809778 Free PMC article.
-
Gene expression signatures of extracellular matrix and growth factors during embryonic stem cell differentiation.PLoS One. 2012;7(10):e42580. doi: 10.1371/journal.pone.0042580. Epub 2012 Oct 15. PLoS One. 2012. PMID: 23077480 Free PMC article.
-
Comprehensive proteomic analysis of exosome mimetic vesicles and exosomes derived from human umbilical cord mesenchymal stem cells.Stem Cell Res Ther. 2022 Jul 15;13(1):312. doi: 10.1186/s13287-022-03008-6. Stem Cell Res Ther. 2022. PMID: 35841000 Free PMC article.
-
Bone marrow mesenchymal stromal cells to treat tissue damage in allogeneic stem cell transplant recipients: correlation of biological markers with clinical responses.Stem Cells. 2014 May;32(5):1278-88. doi: 10.1002/stem.1638. Stem Cells. 2014. PMID: 24452962 Free PMC article. Clinical Trial.
-
Connective Tissue Growth Factor reporter mice label a subpopulation of mesenchymal progenitor cells that reside in the trabecular bone region.Bone. 2015 Feb;71:76-88. doi: 10.1016/j.bone.2014.10.005. Epub 2014 Oct 22. Bone. 2015. PMID: 25464947 Free PMC article.
References
-
- Chen J, Li Y, Wang L, Zhang Z, Lu D, Lu M, et al. Therapeutic benefit of intravenous administration of bone marrow stromal cells after cerebral ischemia in rats. Stroke. 2001 Apr;32(4):1005–11. - PubMed
-
- Mahmood A, Lu D, Chopp M. Marrow stromal cell transplantation after traumatic brain injury promotes cellular proliferation within the brain. Neurosurgery. 2004 Nov;55(5):1185–93. - PubMed
-
- Horwitz EM, Gordon PL, Koo WK, Marx JC, Neel MD, McNall RY, et al. Isolated allogeneic bone marrow-derived mesenchymal cells engraft and stimulate growth in children with osteogenesis imperfecta: Implications for cell therapy of bone. Proc Natl Acad Sci U S A. 2002 Jun 25;99(13):8932–7. - PMC - PubMed
-
- Koc ON, Day J, Nieder M, Gerson SL, Lazarus HM, Krivit W. Allogeneic mesenchymal stem cell infusion for treatment of metachromatic leukodystrophy (MLD) and Hurler syndrome (MPS-IH) Bone Marrow Transplant. 2002 Aug;30(4):215–22. - PubMed
Publication types
MeSH terms
Substances
Grants and funding
LinkOut - more resources
Full Text Sources
Other Literature Sources
Molecular Biology Databases
Miscellaneous
