Characteristics of the earliest cross-neutralizing antibody response to HIV-1
- PMID: 21249232
- PMCID: PMC3020924
- DOI: 10.1371/journal.ppat.1001251
Characteristics of the earliest cross-neutralizing antibody response to HIV-1
Erratum in
- PLoS Pathog. 2011 Mar;7(3). doi: 10.1371/annotation/8b3b24b5-d4ed-483a-b233-0a88513ad499
Abstract
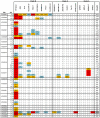
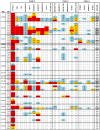
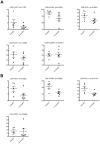
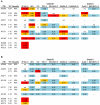
Recent cross-sectional analyses of HIV-1+ plasmas have indicated that broadly cross-reactive neutralizing antibody responses are developed by 10%-30% of HIV-1+ subjects. The timing of the initial development of such anti-viral responses is unknown. It is also unknown whether the emergence of these responses coincides with the appearance of antibody specificities to a single or multiple regions of the viral envelope glycoprotein (Env). Here we analyzed the cross-neutralizing antibody responses in longitudinal plasmas collected soon after and up to seven years after HIV-1 infection. We find that anti-HIV-1 cross-neutralizing antibody responses first become evident on average at 2.5 years and, in rare cases, as early as 1 year following infection. If cross-neutralizing antibody responses do not develop during the first 2-3 years of infection, they most likely will not do so subsequently. Our results indicate a potential link between the development of cross-neutralizing antibody responses and specific activation markers on T cells, and with plasma viremia levels. The earliest cross-neutralizing antibody response targets a limited number of Env regions, primarily the CD4-binding site and epitopes that are not present on monomeric Env, but on the virion-associated trimeric Env form. In contrast, the neutralizing activities of plasmas from subjects that did not develop cross-neutralizing antibody responses target epitopes on monomeric gp120 other than the CD4-BS. Our study provides information that is not only relevant to better understanding the interaction of the human immune system with HIV but may guide the development of effective immunization protocols. Since antibodies to complex epitopes that are present on the virion-associated envelope spike appear to be key components of earliest cross-neutralizing activities of HIV-1+ plasmas, then emphasis should be made to elicit similar antibodies by vaccination.
Conflict of interest statement
The authors have declared that no competing interests exist.
Figures


Similar articles
-
Evolution of cross-neutralizing antibody specificities to the CD4-BS and the carbohydrate cloak of the HIV Env in an HIV-1-infected subject.PLoS One. 2012;7(11):e49610. doi: 10.1371/journal.pone.0049610. Epub 2012 Nov 13. PLoS One. 2012. PMID: 23152926 Free PMC article.
-
Conformational Epitope-Specific Broadly Neutralizing Plasma Antibodies Obtained from an HIV-1 Clade C-Infected Elite Neutralizer Mediate Autologous Virus Escape through Mutations in the V1 Loop.J Virol. 2016 Jan 13;90(7):3446-57. doi: 10.1128/JVI.03090-15. J Virol. 2016. PMID: 26763999 Free PMC article.
-
A Trimeric HIV-1 Envelope gp120 Immunogen Induces Potent and Broad Anti-V1V2 Loop Antibodies against HIV-1 in Rabbits and Rhesus Macaques.J Virol. 2018 Feb 12;92(5):e01796-17. doi: 10.1128/JVI.01796-17. Print 2018 Mar 1. J Virol. 2018. PMID: 29237847 Free PMC article.
-
The Neutralizing Antibody Response to the HIV-1 Env Protein.Curr HIV Res. 2018;16(1):21-28. doi: 10.2174/1570162X15666171124122044. Curr HIV Res. 2018. PMID: 29173180 Free PMC article. Review.
-
GP120: target for neutralizing HIV-1 antibodies.Annu Rev Immunol. 2006;24:739-69. doi: 10.1146/annurev.immunol.24.021605.090557. Annu Rev Immunol. 2006. PMID: 16551265 Review.
Cited by
-
Determination of Binding Affinity of Antibodies to HIV-1 Recombinant Envelope Glycoproteins, Pseudoviruses, Infectious Molecular Clones, and Cell-Expressed Trimeric gp160 Using Microscale Thermophoresis.Cells. 2023 Dec 22;13(1):33. doi: 10.3390/cells13010033. Cells. 2023. PMID: 38201237 Free PMC article.
-
Review of preventative HIV vaccine clinical trials in South Africa.Arch Virol. 2020 Nov;165(11):2439-2452. doi: 10.1007/s00705-020-04777-2. Epub 2020 Aug 14. Arch Virol. 2020. PMID: 32797338 Free PMC article. Review.
-
Increased breadth of HIV-1 neutralization achieved by diverse antibody clones each with limited neutralization breadth.PLoS One. 2018 Dec 19;13(12):e0209437. doi: 10.1371/journal.pone.0209437. eCollection 2018. PLoS One. 2018. PMID: 30566528 Free PMC article.
-
Sequence and structural convergence of broad and potent HIV antibodies that mimic CD4 binding.Science. 2011 Sep 16;333(6049):1633-7. doi: 10.1126/science.1207227. Epub 2011 Jul 14. Science. 2011. PMID: 21764753 Free PMC article.
-
Broad and Potent Neutralizing Antibodies Recognize the Silent Face of the HIV Envelope.Immunity. 2019 Jun 18;50(6):1513-1529.e9. doi: 10.1016/j.immuni.2019.04.014. Epub 2019 May 21. Immunity. 2019. PMID: 31126879 Free PMC article.
References
-
- Tomaras GD, Yates NL, Liu P, Qin L, Fouda GG, et al. Initial B-cell responses to transmitted human immunodeficiency virus type 1: virion-binding immunoglobulin M (IgM) and IgG antibodies followed by plasma anti-gp41 antibodies with ineffective control of initial viremia. J Virol. 2008;82:12449–12463. - PMC - PubMed
Publication types
MeSH terms
Substances
Grants and funding
LinkOut - more resources
Full Text Sources
Other Literature Sources
Medical
Research Materials

