Proteins encoded in genomic regions associated with immune-mediated disease physically interact and suggest underlying biology
- PMID: 21249183
- PMCID: PMC3020935
- DOI: 10.1371/journal.pgen.1001273
Proteins encoded in genomic regions associated with immune-mediated disease physically interact and suggest underlying biology
Abstract
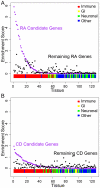
Genome-wide association studies (GWAS) have defined over 150 genomic regions unequivocally containing variation predisposing to immune-mediated disease. Inferring disease biology from these observations, however, hinges on our ability to discover the molecular processes being perturbed by these risk variants. It has previously been observed that different genes harboring causal mutations for the same Mendelian disease often physically interact. We sought to evaluate the degree to which this is true of genes within strongly associated loci in complex disease. Using sets of loci defined in rheumatoid arthritis (RA) and Crohn's disease (CD) GWAS, we build protein-protein interaction (PPI) networks for genes within associated loci and find abundant physical interactions between protein products of associated genes. We apply multiple permutation approaches to show that these networks are more densely connected than chance expectation. To confirm biological relevance, we show that the components of the networks tend to be expressed in similar tissues relevant to the phenotypes in question, suggesting the network indicates common underlying processes perturbed by risk loci. Furthermore, we show that the RA and CD networks have predictive power by demonstrating that proteins in these networks, not encoded in the confirmed list of disease associated loci, are significantly enriched for association to the phenotypes in question in extended GWAS analysis. Finally, we test our method in 3 non-immune traits to assess its applicability to complex traits in general. We find that genes in loci associated to height and lipid levels assemble into significantly connected networks but did not detect excess connectivity among Type 2 Diabetes (T2D) loci beyond chance. Taken together, our results constitute evidence that, for many of the complex diseases studied here, common genetic associations implicate regions encoding proteins that physically interact in a preferential manner, in line with observations in Mendelian disease.
Conflict of interest statement
The authors have declared that no competing interests exist.
Figures


Similar articles
-
Integrated enrichment analysis of variants and pathways in genome-wide association studies indicates central role for IL-2 signaling genes in type 1 diabetes, and cytokine signaling genes in Crohn's disease.PLoS Genet. 2013;9(10):e1003770. doi: 10.1371/journal.pgen.1003770. Epub 2013 Oct 3. PLoS Genet. 2013. PMID: 24098138 Free PMC article.
-
Evidence for a potential role of miR-1908-5p and miR-3614-5p in autoimmune disease risk using integrative bioinformatics.J Autoimmun. 2018 Nov;94:83-89. doi: 10.1016/j.jaut.2018.07.010. Epub 2018 Aug 22. J Autoimmun. 2018. PMID: 30143393
-
Developing a network view of type 2 diabetes risk pathways through integration of genetic, genomic and functional data.Genome Med. 2019 Mar 26;11(1):19. doi: 10.1186/s13073-019-0628-8. Genome Med. 2019. PMID: 30914061 Free PMC article.
-
Shared genetic etiology underlying Alzheimer's disease and type 2 diabetes.Mol Aspects Med. 2015 Jun-Oct;43-44:66-76. doi: 10.1016/j.mam.2015.06.006. Epub 2015 Jun 23. Mol Aspects Med. 2015. PMID: 26116273 Free PMC article. Review.
-
Prioritising Causal Genes at Type 2 Diabetes Risk Loci.Curr Diab Rep. 2017 Sep;17(9):76. doi: 10.1007/s11892-017-0907-y. Curr Diab Rep. 2017. PMID: 28758174 Free PMC article. Review.
Cited by
-
Genome-wide meta-analyses of multiancestry cohorts identify multiple new susceptibility loci for refractive error and myopia.Nat Genet. 2013 Mar;45(3):314-8. doi: 10.1038/ng.2554. Epub 2013 Feb 10. Nat Genet. 2013. PMID: 23396134 Free PMC article.
-
Novel Genes Affecting Blood Pressure Detected Via Gene-Based Association Analysis.G3 (Bethesda). 2015 Mar 26;5(6):1035-42. doi: 10.1534/g3.115.016915. G3 (Bethesda). 2015. PMID: 25820152 Free PMC article.
-
Selecting causal genes from genome-wide association studies via functionally coherent subnetworks.Nat Methods. 2015 Feb;12(2):154-9. doi: 10.1038/nmeth.3215. Epub 2014 Dec 22. Nat Methods. 2015. PMID: 25532137 Free PMC article.
-
Prioritizing causal disease genes using unbiased genomic features.Genome Biol. 2014 Dec 3;15(12):534. doi: 10.1186/s13059-014-0534-8. Genome Biol. 2014. PMID: 25633252 Free PMC article.
-
HYST: a hybrid set-based test for genome-wide association studies, with application to protein-protein interaction-based association analysis.Am J Hum Genet. 2012 Sep 7;91(3):478-88. doi: 10.1016/j.ajhg.2012.08.004. Am J Hum Genet. 2012. PMID: 22958900 Free PMC article.
References
-
- Barrett JC, Clayton DG, Concannon P, Akolkar B, Cooper JD, et al. Genome-wide association study and meta-analysis find that over 40 loci affect risk of type 1 diabetes. Nat Genet. 2009. Available at: http://www.ncbi.nlm.nih.gov.ezp-prod1.hul.harvard.edu/pubmed/19430480. Accessed 19 March 2010. - PMC - PubMed
Publication types
MeSH terms
Grants and funding
- R01 HD055150-03/HD/NICHD NIH HHS/United States
- P30 DK040561/DK/NIDDK NIH HHS/United States
- P30 DK043351/DK/NIDDK NIH HHS/United States
- G0600329/MRC_/Medical Research Council/United Kingdom
- G0800759/MRC_/Medical Research Council/United Kingdom
- ETM/75/CSO_/Chief Scientist Office/United Kingdom
- WT_/Wellcome Trust/United Kingdom
- K08 AR055688-04/AR/NIAMS NIH HHS/United States
- R01 DK083756/DK/NIDDK NIH HHS/United States
- K08 AR055688-03/AR/NIAMS NIH HHS/United States
- RC1 DK086502/DK/NIDDK NIH HHS/United States
- R01 HD055150/HD/NICHD NIH HHS/United States
- G0800675/MRC_/Medical Research Council/United Kingdom
- DK083756/DK/NIDDK NIH HHS/United States
- K08 AR055688-01A1/AR/NIAMS NIH HHS/United States
- P30 DK040561-15/DK/NIDDK NIH HHS/United States
- R01 DK064869/DK/NIDDK NIH HHS/United States
- T32 GM007753/GM/NIGMS NIH HHS/United States
- K08 AR055688-01A1S1/AR/NIAMS NIH HHS/United States
- CZB/4/540/CSO_/Chief Scientist Office/United Kingdom
- K08 AR055688/AR/NIAMS NIH HHS/United States
- DK086502/DK/NIDDK NIH HHS/United States
- P01 DK046763/DK/NIDDK NIH HHS/United States
LinkOut - more resources
Full Text Sources
Other Literature Sources
Medical

