. 2011 May;300(5):C1107-21.
doi: 10.1152/ajpcell.00378.2010. Epub 2011 Jan 19.

Temporal and spatial patterns of endogenous danger signal expression after wound healing and in response to lymphedema

Affiliations

Temporal and spatial patterns of endogenous danger signal expression after wound healing and in response to lymphedema

Jamie C Zampell et al. Am J Physiol Cell Physiol. 2011 May.

Abstract

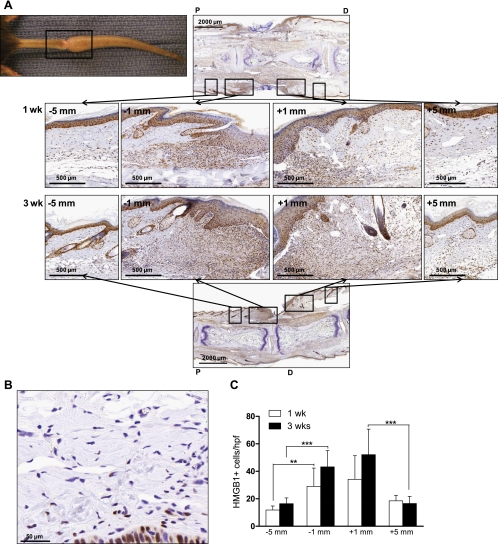
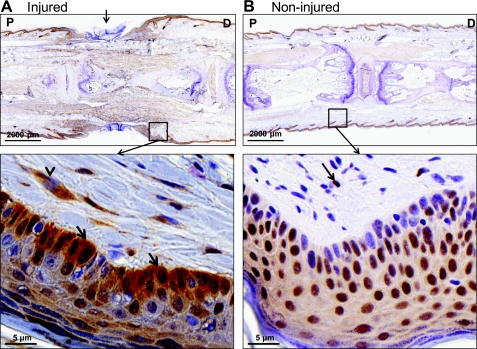
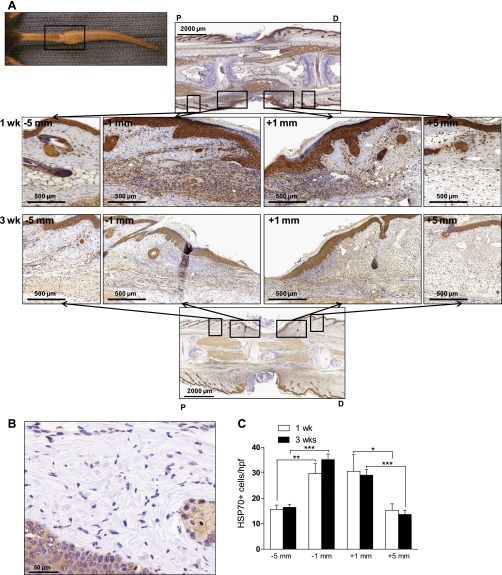
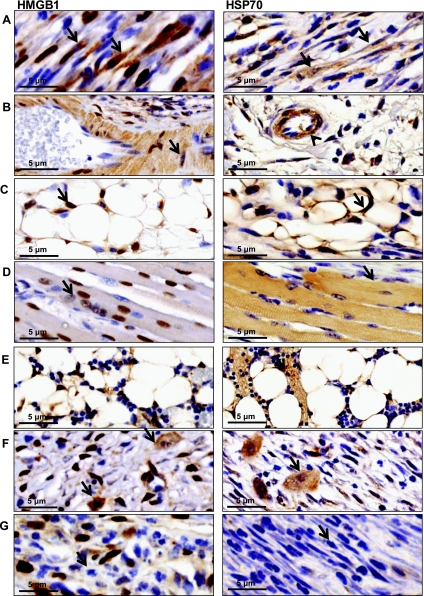
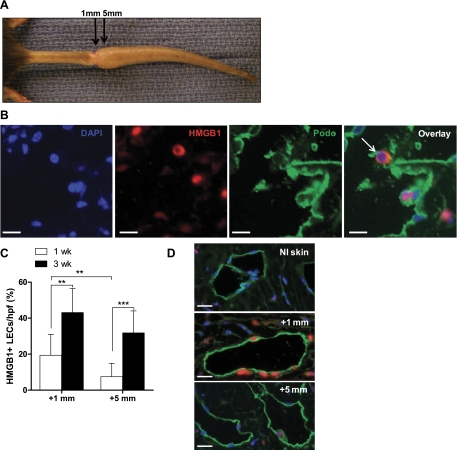
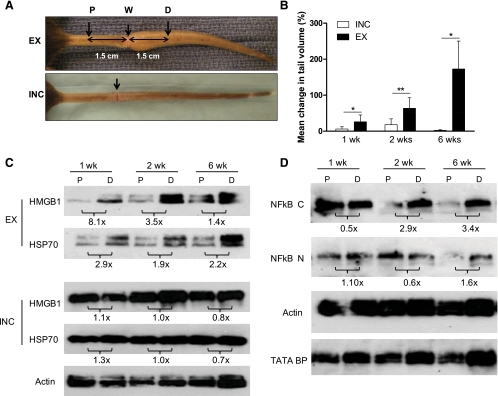
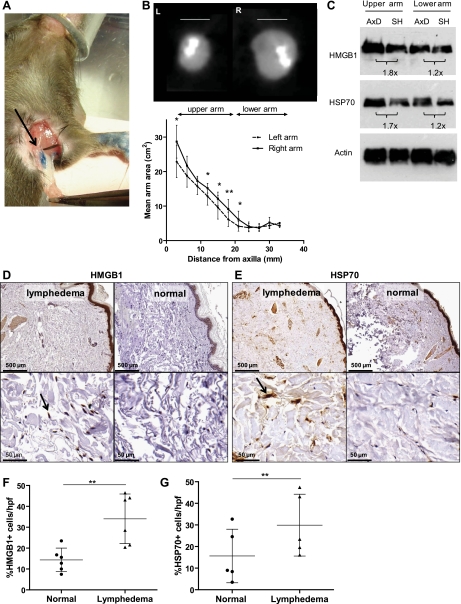
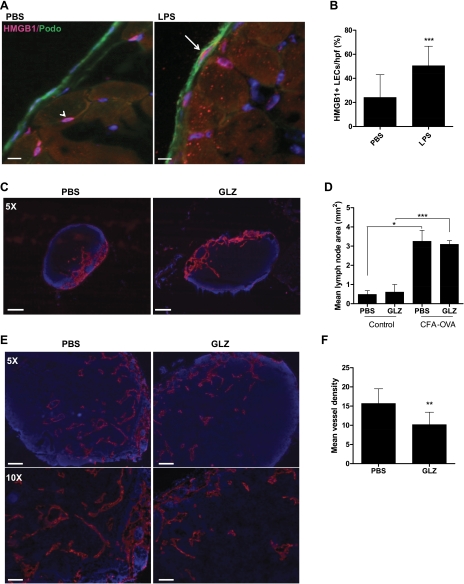
While acute tissue injury potently induces endogenous danger signal expression, the role of these molecules in chronic wound healing and lymphedema is undefined. The purpose of this study was to determine the spatial and temporal expression patterns of the endogenous danger signals high-mobility group box 1 (HMGB1) and heat shock protein (HSP)70 during wound healing and chronic lymphatic fluid stasis. In a surgical mouse tail model of tissue injury and lymphedema, HMGB1 and HSP70 expression occurred along a spatial gradient relative to the site of injury, with peak expression at the wound and greater than twofold reduced expression within 5 mm (P < 0.05). Expression primarily occurred in cells native to injured tissue. In particular, HMGB1 was highly expressed by lymphatic endothelial cells (>40% positivity; twofold increase in chronic inflammation, P < 0.001). We found similar findings using a peritoneal inflammation model. Interestingly, upregulation of HMGB1 (2.2-fold), HSP70 (1.4-fold), and nuclear factor (NF)-κβ activation persisted at least 6 wk postoperatively only in lymphedematous tissues. Similarly, we found upregulation of endogenous danger signals in soft tissue of the arm after axillary lymphadenectomy in a mouse model and in matched biopsy samples obtained from patients with secondary lymphedema comparing normal to lymphedematous arms (2.4-fold increased HMGB1, 1.9-fold increased HSP70; P < 0.01). Finally, HMGB1 blockade significantly reduced inflammatory lymphangiogenesis within inflamed draining lymph nodes (35% reduction, P < 0.01). In conclusion, HMGB1 and HSP70 are expressed along spatial gradients and upregulated in chronic lymphatic fluid stasis. Furthermore, acute expression of endogenous danger signals may play a role in inflammatory lymphangiogenesis.


Figures

Fig. 1.
Fig. 1.
High-mobility group box 1 (HMGB1) expression occurs along a spatial gradient relative to the site of tissue injury. A: gross representation of mouse tail wound (top left). The indicated (black boxed) region was sectioned sagitally at 1 or 3 wk postoperatively and subjected to immunohistochemical staining for HMGB1. Representative ×3 and ×10 images are displayed across the region of the wound. ×10 images represent the regions proximal and distal to the wound (5 or 1 mm on either side). B: representative immunohistochemistry (IHC) for HMGB1 performed on noninjured dermis of the mouse tail. C: number of positively stained cells were counted at 5 or 1 mm proximal (−5 mm, −1 mm) or distal (+1 mm, +5 mm) to the wound as indicated for both postoperative time points. Bars represent the mean number of positive cells per high power field (hpf) ± SD, **P < 0.01, ***P < 0.001.
Fig. 2.
Fig. 2.
HMGB1 translocates from the nucleus to the cytoplasm following tissue injury. A: representative IHC (×3, top) for HMGB1 across the site of injury (arrow) at 3 wk postoperatively. HMGB1 staining of dermis and epidermis is represented below (×20); arrowheads indicate cytoplasmic staining (brown) in fibroblasts; arrows indicate cytoplasmic staining in keratinocytes. B: IHC for HMGB1 of noninjured mouse tail (×3, top); arrows indicate nuclear staining of fibroblasts and keratinocytes.
Fig. 3.
Fig. 3.
Heat shock protein 70 (HSP70) expression occurs along a spatial gradient relative to the site of tissue injury. A: gross representation of mouse tail wound (top left). The indicated (black boxed) region was sectioned sagitally at 1 or 3 wk postoperatively and subjected to immunohistochemical staining for HSP70. Representative ×3 and ×10 images are displayed across the region of the wound. ×10 images represent the regions proximal and distal to the wound (5 or 1 mm on either side). B: representative IHC for HSP70 performed on noninjured dermis of the mouse tail. C: number of positively stained cells were counted at 5 or 1 mm proximal (−5 mm, −1 mm) or distal (+1 mm, +5 mm) to the wound as indicated for both postoperative time points. Bars represent the mean number of positive cells per hpf ± SD, *P < 0.05, **P < 0.01, ***P < 0.001.
Fig. 4.
Fig. 4.
Endogenous danger signal expression is induced in cells native to injured tissue. Representative high-power views (×100) of immunohistochemical staining for HMGB1 (left) or HSP70 (right) obtained 3–5 mm distal to tail wounds at 3 wk postoperatively. Positive cellular staining for both markers was present in fibroblasts (arrow) (A), vascular endothelium (arrowhead) (B) including smooth muscle cells of vascular endothelium (arrow), and adipocytes (C) (arrow). Skeletal muscles cells in close proximity to the wound stained positively for HMGB1 but not HSP70 (D). Bone marrow (E) and macrophages (F) stained positively for HSP70 and HMGB1 at postoperative week 3. Infiltrating lymphocytes and neutrophils remained negative (G). N = 5 slides were analyzed per group by a blinded pathologist and independent reviewer.
Fig. 5.
Fig. 5.
Tissue injury induces endogenous danger signal expression by lymphatic endothelial cells. A: gross representation of the injured mouse tail at 3 wks postoperatively; double immunofluorescence for HMGB1 and podoplanin was performed on longitudinal sections and analyzed immediately distal (within 1 mm) to the wound or 5 mm distal to the wound as indicated. B: DAPI (blue), HMGB1 [tetramethyl rhodamine isothiocyanate (TRITC), red], and podoplanin [fluorescein isothiocyanate (FITC), green] single stains and image overlays are displayed. Arrows indicate HMGB1-podoplanin double-positive cells. C: counts of positively stained cells were performed at 1 or 5 mm distal to the center of the wound. Mean percentage of HMGB1+ LECs per hpf is displayed. Bars represent means ± SD, **P < 0.01, ***P < 0.001. D: representative lymphatic vessel staining for HMGB1 within normal skin, 1 mm distal to tail wounds, or 5 mm distal to the wound.
Fig. 6.
Fig. 6.
Endogenous danger signal expression is upregulated in sustained lymphatic fluid stasis. A: representative gross images of tails 3 wk postoperatively following tail skin excision and lymphatic disruption (EX, top) or circumferential incision without lymphatic disruption (INC, bottom). Protein from tail tissues was harvested 1.5 cm proximal (P) or distal (D) to the wound (W). B: mean percentage change in tail volume at 1, 2, and 6 wk postoperatively (from preoperative baseline) are displayed; bars represent means ± SD. *P < 0.05, **P < 0.01. C: Western blot analysis of pooled protein samples (n = 5) from the indicated locations (P, D) for HMGB1, HSP70, or actin at 1, 2, and 6 wk performed for both EX and INC groups. Protein from 1, 2, and 6 wk time points were run simultaneously. ImageJ analysis comparing band density at P and D and normalized to actin are displayed as fold change below blots. D: cytoplasmic and nuclear protein fractions isolated from the same tissue regions were subjected to Western blot analysis for NF-κβ (NF-κβ C and NF-κβ N, respectively), actin, or TATA BP nuclear loading control at 1, 2, and 6 wk. ImageJ analysis demonstrating fold change from P to D and normalized to loading control is displayed below blots. All blots were run in at least triplicate and fold change in band density represents an average of at least 3 ImageJ analyses.
Fig. 7.
Fig. 7.
Endogenous danger signal expression is upregulated after axillary lymph node dissection. A: gross image of axillary lymph nodes (arrow) and axillary fat pad resected following distal injection of blue dye in paw. B: axillary dissection (AxD) was performed in the right axilla and sham operation (SH) in the left axilla (n = 8); arm areas were determined from consecutive transverse CT slices as represented. Areas were determined every 3 mm starting 5 mm from the axilla and graphed according to distance distal to the axilla; bars represent means ± SD, *P < 0.05, **P < 0.01. C: Western blot analysis of HMGB1, HSP70, and actin expression from tissues of upper and lower arms (AxD, Axillary dissection; SH, sham). ImageJ analysis of fold-change in band density is displayed below blots. All blots were performed in at least triplicate. D and E: representative HMGB1 and HSP70 immunohistochemical staining of matched human punch biopsy specimen obtained from lymphedematous (left) and nonlymphedematous (right) contralateral limbs (n = 6); representative low (×5, top) and high power (×50, bottom) views are displayed. Arrow indicates positive cell. F and G: percentage of HMGB1+ or HSP70+ cells per hpf is displayed; bars represent means ± SD, **P < 0.01.
Fig. 8.
Fig. 8.
HMGB1 blockade attenuates inflammatory lymphangiogenesis in draining lymph nodes. A: HMGB1 (pink) and podoplanin (green) double immunofluorescence of mouse diaphragms (n = 6 per group) after 2 wk daily administration of PBS or LPS. Arrow indicates costained LEC. Note presence of positively stained cells in PBS-treated animals not colocalized with podoplanin (arrowhead). Scale bars represent 10 μm. B: HMGB1/podoplanin double-positive cells on the peritoneal surface of the diaphragm. Bars represent means ± SD, **P < 0.01, ***P < 0.001. C: lymphatic vessel endothelial hylaluronan (LYVE)-1 stains of popliteal nodes from animals treated with PBS or glycyrrhizin (GLZ). Scale bars represent 100 μm. D: mean lymph node area (mm2) for control or complete freund's adjuvant (CFA)-ovalbumin (OVA)-treated animals treated with PBS or GLZ (n = 6). Bars represent means ± SD, *P < 0.05, ***P < 0.001. E: LYVE-1 staining in lymph nodes harvested from animals treated with CFA-OVA and PBS (left) or GLZ (right). Scale bars represent 200 μm (top) and 100 μm (bottom). F: lymphatic vessel density in animals treated with CFA-OVA and PBS or GLZ. Bars represent means ± SD, **P < 0.01.

Similar articles

Cited by

References

    1. Akira S, Uematsu S, Takeuchi O.Pathogen recognition and innate immunity.Cell 124: 783–801, 2006 - PubMed
    1. Andersson U, Tracey KJ.HMGB1 in sepsis.Scand J Infect Dis 35: 577–584, 2003 - PubMed
    1. Avraham T, Clavin NW, Daluvoy SV, Fernandez J, Soares MA, Cordeiro AP, Mehrara BJ.Fibrosis is a key inhibitor of lymphatic regeneration.Plast Reconstr Surg 124: 438–450, 2009 - PubMed
    1. Avraham T, Daluvoy S, Zampell J, Yan A, Haviv YS, Rockson SG, Mehrara BJ.Blockade of transforming growth factor-beta1 accelerates lymphatic regeneration during wound repair.Am J Pathol 177: 3202–3214, 2010 - PMC - PubMed
    1. Bianchi ME.DAMPs, PAMPs and alarmins: all we need to know about danger.J Leukoc Biol 81: 1–5, 2007 - PubMed

Publication types

MeSH terms