Raised temperatures over the Kericho tea estates: revisiting the climate in the East African highlands malaria debate
- PMID: 21241505
- PMCID: PMC3031277
- DOI: 10.1186/1475-2875-10-12
Raised temperatures over the Kericho tea estates: revisiting the climate in the East African highlands malaria debate
Abstract
Background: Whether or not observed increases in malaria incidence in the Kenyan Highlands during the last thirty years are associated with co-varying changes in local temperature, possibly connected to global changes in climate, has been debated for over a decade. Studies, using differing data sets and methodologies, produced conflicting results regarding the occurrence of temperature trends and their likelihood of being responsible, at least in part, for the increases in malaria incidence in the highlands of western Kenya. A time series of quality controlled daily temperature and rainfall data from Kericho, in the Kenyan Highlands, may help resolve the controversy. If significant temperature trends over the last three decades have occurred then climate should be included (along with other factors such as land use change and drug resistance) as a potential driver of the observed increases in malaria in the region.
Methods: Over 30 years (1 January 1979 to 31 December 2009) of quality controlled daily observations ( > 97% complete) of maximum, minimum and mean temperature were used in the analysis of trends at Kericho meteorological station, sited in a tea growing area of Kenya's western highlands. Inhomogeneities in all the time series were identified and corrected. Linear trends were identified via a least-squares regression analysis with statistical significance assessed using a two-tailed t-test. These 'gold standard' meteorological observations were compared with spatially interpolated temperature datasets that have been developed for regional or global applications. The relationship of local climate processes with larger climate variations, including tropical sea surface temperatures (SST), and El Niño-Southern Oscillation (ENSO) was also assessed.
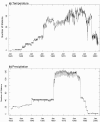
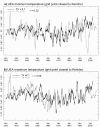
Results: An upward trend of ≈0.2°C/decade was observed in all three temperature variables (P < 0.01). Mean temperature variations in Kericho were associated with large-scale climate variations including tropical SST (r = 0.50; p < 0.01). Local rainfall was found to have inverse effects on minimum and maximum temperature. Three versions of a spatially interpolated temperature data set showed markedly different trends when compared with each other and with the Kericho station observations.
Conclusion: This study presents evidence of a warming trend in observed maximum, minimum and mean temperatures at Kericho during the period 1979 to 2009 using gold standard meteorological observations. Although local factors may be contributing to these trends, the findings are consistent with variability and trends that have occurred in correlated global climate processes. Climate should therefore not be dismissed as a potential driver of observed increases in malaria seen in the region during recent decades, however its relative importance compared to other factors needs further elaboration. Climate services, pertinent to the achievement of development targets such as the Millennium Development Goals and the analysis of infectious disease in the context of climate variability and change are being developed and should increase the availability of relevant quality controlled climate data for improving development decisions. The malaria community should seize this opportunity to make their needs heard.
Figures



Similar articles
-
Testing a multi-malaria-model ensemble against 30 years of data in the Kenyan highlands.Malar J. 2014 May 30;13:206. doi: 10.1186/1475-2875-13-206. Malar J. 2014. PMID: 24885824 Free PMC article.
-
The Indian Ocean Dipole and malaria risk in the highlands of western Kenya.Proc Natl Acad Sci U S A. 2009 Feb 10;106(6):1857-62. doi: 10.1073/pnas.0806544106. Epub 2009 Jan 27. Proc Natl Acad Sci U S A. 2009. PMID: 19174522 Free PMC article.
-
Temperature and malaria trends in highland East Africa.PLoS One. 2011;6(9):e24524. doi: 10.1371/journal.pone.0024524. Epub 2011 Sep 15. PLoS One. 2011. PMID: 21935416 Free PMC article.
-
Methodological problems and amendments to demonstrate effects of temperature on the epidemiology of malaria. A new perspective on the highland epidemics in Madagascar, 1972-89.Trans R Soc Trop Med Hyg. 2003 Mar-Apr;97(2):133-9. doi: 10.1016/s0035-9203(03)90099-x. Trans R Soc Trop Med Hyg. 2003. PMID: 14584363 Review.
-
Climate variability and malaria epidemics in the highlands of East Africa.Trends Parasitol. 2005 Feb;21(2):54-6. doi: 10.1016/j.pt.2004.11.002. Trends Parasitol. 2005. PMID: 15664525 Review.
Cited by
-
El Niño and other climatic drivers of epidemic malaria in Ethiopia: new tools for national health adaptation plans.Malar J. 2023 Jun 24;22(1):195. doi: 10.1186/s12936-023-04621-3. Malar J. 2023. PMID: 37355627 Free PMC article.
-
Climate change and infectious disease: A prologue on multidisciplinary cooperation and predictive analytics.Front Public Health. 2023 Jan 20;11:1018293. doi: 10.3389/fpubh.2023.1018293. eCollection 2023. Front Public Health. 2023. PMID: 36741948 Free PMC article.
-
Impacts of climate and land use/cover changes on streamflow at Kibungo sub-catchment, Tanzania.Heliyon. 2022 Oct 26;8(11):e11285. doi: 10.1016/j.heliyon.2022.e11285. eCollection 2022 Nov. Heliyon. 2022. PMID: 36339757 Free PMC article.
-
Potential future malaria transmission in Odisha due to climate change.Sci Rep. 2022 May 31;12(1):9048. doi: 10.1038/s41598-022-13166-5. Sci Rep. 2022. PMID: 35641573 Free PMC article.
-
Epidemic malaria dynamics in Ethiopia: the role of self-limiting, poverty, HIV, climate change and human population growth.Malar J. 2022 Apr 27;21(1):135. doi: 10.1186/s12936-022-04161-2. Malar J. 2022. PMID: 35477448 Free PMC article.
References
-
- Thomson MC, Mason SJ, Phindela T, Connor SJ. Use of rainfall and Sea Surface Temperature monitoring for Malaria Early Warning in Botswana. Am J Trop Med Hyg. 2005;73:214–221. - PubMed
-
- Mouchet J, Manguin S. Global warming and malaria expansion. Annales de la Société Entomologique de France. 1999;35:549–555.
Publication types
MeSH terms
LinkOut - more resources
Full Text Sources
Medical

