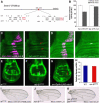
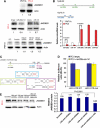
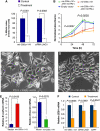
. 2011 Feb 16;30(4):756-69.
doi: 10.1038/emboj.2010.358. Epub 2011 Jan 11.

Targeting Notch signalling by the conserved miR-8/200 microRNA family in development and cancer cells

Affiliations

Targeting Notch signalling by the conserved miR-8/200 microRNA family in development and cancer cells

Diana M Vallejo et al. EMBO J. .

Abstract

Notch signalling is crucial for the correct development and growth of numerous organs and tissues, and when subverted it can cause cancer. Loss of miR-8/200 microRNAs (miRNAs) is commonly observed in advanced tumours and correlates with their invasion and acquisition of stem-like properties. Here, we show that this miRNA family controls Notch signalling activation in Drosophila and human cells. In an overexpression screen, we identified the Drosophila miR-8 as a potent inhibitor of Notch-induced overgrowth and tumour metastasis. Gain and loss of mir-8 provoked developmental defects reminiscent of impaired Notch signalling and we demonstrated that miR-8 directly inhibits Notch ligand Serrate. Likewise, miR-200c and miR-141 directly inhibited JAGGED1, impeding proliferation of human metastatic prostate cancer cells. It has been suggested that JAGGED1 may also be important for metastases. Although in metastatic cancer cells, JAGGED1 modestly regulated ZEB1, the miR-200c's target in invasion, studies in Drosophila revealed that only concurrent overexpression of Notch and Zfh1/ZEB1 induced tumour metastases. Together, these data define a new way to attenuate or boost Notch signalling that may have clinical interest.


Conflict of interest statement

The authors declare that they have no conflict of interest.

Figures
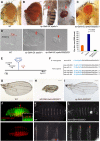
Figure 1
Figure 1
Identification of conserved mir-8 as a negative regulator of growth and tumourigenesis through Notch signalling. (A) Control of female wild-type (WT) eye size. (B) Representative fly showing eye tumour growth (left) and metastasis in the abdomen (red tumour mass, arrows) in the Drosophila cancer paradigm used in the screening that identified the miR-8 microRNA. The bottom image shows the metastatic mass in the open abdomen (arrows) of the same fly. (C) A representative of tumour suppression by GS(2)SC1 (genotype ey-Gal4>UAS-Dl, eyeful/GS(2)SC1). Adult flies and late pupa of this genotype scored 0 metastasis (0/100 animals) and strong reduction of eye tumour growth. (D) Qualitative and quantitative analyses of the suppression of primary tumour growth by GS(2)SC1. Representative images of a WT eye disc, tumour eye-antennal disc (arrow; genotype ey-Gal>UAS-Dl, eyeful/+), and suppressed tumour disc (arrowhead; genotype ey-Gal4>UAS-Dl, eyeful/GS(2)SC1). Graph shows quantification of the total eye disc areas scored in 20 eye discs from the three genotypes: WT (red bar); tumour (genotype ey-Gal4>UAS-Dl, eyeful/+: blue bar); and tumour suppression by GS(2)SC1 (ey-Gal4>UAS-Dl, eyeful/GS(2)SC1: green bar). Error bars represent the standard error of the mean (s.e.m.). P-values are obtained using unpaired Students' t-test. (E) Map of the GS(2)SC1 insertion near mir-8. (F) The miR-8/200 miRNA precursor family. (G) Male wing size control. (H) MS1096-Gal4>GS(2)SC1 and (I) vg-Gal4>GS(2)SC1 wings show typical Ser-like phenotypes (small wing, 100% n=50; H) and (wing nicks, 100% n=60; I). MS1096-Gal4 and vg-Gal4 drive early expression in the dorsal compartment and late expression in the D/V boundary of the wing disc, respectively. (J) Stages 14 and 15 embryo showing mir-8 microRNA segmental expression (mir-8-Gal4>lacZ, red) overlapping the Ser protein (green). (K) Control cuticle embryo and detail (below). (L) Overexpressing mir-8 via GS(2)SC1 by hairy-Gal4 showed typical Ser embryonic denticle belt defects.
Figure 2
Figure 2
miR-8 represses growth by inducing apoptosis and blocking cell proliferation via Serrate. (A) Representation of Ser expression and signalling (green) in first to third larval eye disc development. A D/V growth-promoting organizer is established during the late LII stage by local activation of Notch (yellow) by Dl (blue) and Ser. Retinal differentiation initiates from the posterior end of the disc (red). (BD) The mirrP69Df7P[w+] line marks the subdivision of the eye into dorsal (d) and ventral (v) compartments in WT control eye (B) and mir-8 overexpressing eyes (ey-Gal4>GS(2)SC1; C, D). Note the reduction of the ventral eye region (C) and the profound distortion of the D/V boundary (D). (E) Ubiquitous overexpression of mir-8 only produced apoptosis in the ventral region of first instar or (F) in the organizer region of late third instar discs, as visualized through cleaved caspase-3 (red). (G) Mitosis visualized by phospho-histone H3 (red) in control and (H) mir-8 overexpressing eye discs. Note the absence of mitosis in the ventral eye (arrow). Cells are outlined by anti-armadillo staining (blue). (I) eyg-lacZ (red) marker of Notch induced the D/V organizer in the WT and (J) mir-8 overexpressing eye discs (genotype: ey-Gal4>GS(2)SC1; eyg-lacZ). (K) Gain of Ser (n=24) but not atrophin (n=32) rescued the eye growth defect induced by miR-8 overexpression. Female eyes were scored and the error bars show the s.e.m. Differences between ey-Gal4>GS(2)SC1 and ey-Gal4>GS(2)SC1>UAS-atro are not statistically significant (P=0.32). P-values are obtained using unpaired Students' t-test. (L) Representative adult eye of ey-Gal4>GS(2)SC1>Ser−/+ flies.
Figure 3
Figure 3
Serrate is directly repressed by miR-8 via translational inhibition. (A) Computer prediction of two miR-8-binding sites in the Ser 3′UTR (seed sequence in red). (B) Luciferase assay in Drosophila Schneider (S2) cells co-transfected with mir-8 or the empty vector, together with a firefly luciferase vector containing the Ser 3′UTR (Ser-UTR-WT) or a luciferase vector with mutations in the seed sequence (underlined bases in (A): Ser-UTR-mut). (C, D) Overexpression of mir-8 by dpp-Gal4 caused a modest but reproducible downregulation of GFP in a tub-eGFP:SerUTR sensor (C), but not in the tub-eGFP:SerUTR mutated control in the stripe of cells within the dpp domain (arrows, D). Nineteen tub-eGFP:SerUTR and nine tub-eGFP:SerUTRmut independent transgenic lines were studied. Wing discs showing Ser protein (green) in (E) WT, (F) mir-8 mutant (mir-8Δ2/Δ3), or (G) mir-8 overexpressing mutants driven by en-Gal4. The en-Gal4 drives expression in the posterior compartment of the wing disc (right in the image, red arrow). (H) Ser mRNA levels of WT and mir-8Δ2 mutant larvae assayed by qPCR were not statistically different (P=0.457; n=3, mean±s.e.m.). (I) Adult male wings (all to scale) from males of w1118 (control), (J) w1118; mir-8Δ2/Δ2, and (K) w1118; mir-8Δ2/Δ3; SerRX106/+. In the complete absence of mir-8, wing size is reduced by 10% and had extra veins. Reducing by 50% gene dosage of Ser fully rescued wing size and partly the extra veins. Mean areas of adult wings (n=16) in each genotype expressed in RGB pixels are shown. Rescued by Ser mutation is statistically significant (two-tailed, P<0.0001).
Figure 4
Figure 4
Direct inhibition of JAGGED1 by miR-200c∼141 in metastatic prostate cancer mesenchymal cells. (A) Immunoblot analysis of JAG1 protein in human non-tumourigenic epithelial prostate cells PNT1A and bone-derived metastatic prostate cancer cells PC-3 (top). JAG1 protein levels decreased or increased in the presence of miR-200c and miR-141 overexpressing vectors (PC-3 cells, middle blot) or the presence of LNAs in the transformed epithelial prostate cells (bottom blot). The controls are PC-3 cells transfected with the empty vector (middle blot) and the presence or absence (NTC) of scramble LNAs (bottom blot). Equal loading of samples was confirmed by blotting with anti-actin mAb. A representative western blot is shown and quantification below show JAG1 staining relative to control cells in triplicate (B) qPCR of microRNAs of the mir-200c∼141 cluster (mir-200c and mir-141) and mir-200b∼429 cluster (mir-200b, mir-200a, and mir-429) in the PC-3 and PNT1A cells. Data shown were normalized to RNU6 (C) JAG1 3′UTR showing the miR-200-binding sites and the JAG1-miR-200c or -miR-141 duplexes (boxes). (D) Reduced luciferase activity of pRL-TK vector containing the human JAG1–3′UTR-WT in PC-3 cells stably transfected with mir-200c/141 expressing or empty vectors and compared with JAG1-3′UTR-mut reporter with mutations in the three miRNA-binding sites (asterisks in C). (E) JAG1 protein levels are reduced in the presence of three LNAs of the mir-200b∼429 cluster. PC-3 cells were treated with LNA anti-sense oligonucleotides of miR-200a, miR-200b, miR-429, a mixture of the three or scramble LNAs and a representative immunoblot (left) and histogram from three independent experiments (right) are shown. P-values are obtained using unpaired Students' t-test in (B, D, E), n=3, mean±s.e.m.
Figure 5
Figure 5
miR-200c∼141 inhibit cell proliferation of metastatic prostate cancer cells by repressing JAG1. (A) Significant reduction of cell proliferation of PC-3 cells stably transfected with mir-200c- and mir-141-expressing vectors, or transiently treated with JAG1 siRNAs, relative to PC-3 control cells empty vector or treated with scramble siRNAs. The mitotic index was quantified as the ratio between the phosphohistone H3 positive cells and the total number of cells in four independent assays. Error bars show s.e.m. (n=3). (B) Time course of PC-3 cells expressing the microRNAs and/or JAG1 with or without its 3′UTR as determined by the WST-1 proliferation assay (Roche). Cells transiently transfected with the microRNA miR-200c and miR-141 vectors and/or the indicated JAG1 vectors, or control empty vectors, were seeded in quadruplicate and viable cells were counted at specified time points after transfection using WST-1 assays. The data are plotted as the mean absorbance values at 415 nm minus those at 595 nm from three independent experiments and error bars represent s.e.m. P-values based on unpaired t-test at 24 and 48 h indicate statistically significant differences between PC-3 cells co-expressing the microRNAs and JAG1 without it endogenous 3′UTR (3′UTR–) (green line) and PC-3 cells expressing only the microRNAs (red line). (C, D) Overexpression of mir-200c∼141 but not the loss of JAG1 by siRNAs (data not shown) triggered the mesenchymal–epithelial transition. Representative microphotographs of PC-3 cells transfected with empty vector (C) or stably transfected with vectors expressing mir-200c and mir-141 (D). PC-3 cells stably transfected with mir-200c∼141 grew in a monolayer and adopted an epithelial morphology. (E) Expression of human E-cadherin and Vimentin mRNA in PC-3 cells as in (C, D). Errors show s.e.m. (n=3). (F) ZEB1 mRNA expression in stably transfected PC-3 cells with the mir-200c- and mir-141-expressing vectors, and PC-3 treated with JAG1 siRNA or DAPT. Control cells were transfected with an empty vector, scramble siRNAs or treated with DMSO. Error bars represent s.e.m. of three independent experiments. P-values are obtained using unpaired Student's t-test (E, F).
Figure 6
Figure 6
Concurrent expression of mir-200c∼141 and their targets JAGGED1 and ZEB1 in metastatic colon cancer epithelial cells. (A) Relative expression of components of the mir-200 family genes and (B) ZEB1 mRNA in colonic cancer cells (Ls174T, HCT-116, SW-480, and Caco-2) measured by qPCR. (C, D) Differential expression of JAG1 assayed by immunoblot analysis of JAG1 protein levels (C) or mRNA by qPCR (D) in the colonic cancer cells. The levels of expression in Caco-2 cells (A, B, D) were used for normalization and the error bars show s.e.m., n=3 in each case. P-values are obtained using unpaired t-test in (B, D).

Similar articles

Cited by

References

    1. Artavanis-Tsakonas S, Rand MD, Lake RJ (1999) Notch signaling: cell fate control and signal integration in development. Science 284: 770–776 - PubMed
    1. Bailey JM, Singh PK, Hollingsworth MA (2007) Cancer metastasis facilitated by developmental pathways: Sonic hedgehog, Notch, and bone morphogenic proteins. J Cell Biochem 102: 829–839 - PubMed
    1. Bartel DP (2009) MicroRNAs: target recognition and regulatory functions. Cell 136: 215–233 - PMC - PubMed
    1. Bhattacharyya SN, Habermacher R, Martine U, Closs EI, Filipowicz W (2006) Relief of microRNA-mediated translational repression in human cells subjected to stress. Cell 125: 1111–1124 - PubMed
    1. Broihier HT, Moore LA, Van Doren M, Newman S, Lehmann R (1998) zfh-1 is required for germ cell migration and gonadal mesoderm development in Drosophila. Development 125: 655–666 - PubMed

Publication types

MeSH terms

LinkOut - more resources