. 2011 Jan 17;208(1):23-39.
doi: 10.1084/jem.20101202. Epub 2011 Jan 10.

Neuroprotection and progenitor cell renewal in the injured adult murine retina requires healing monocyte-derived macrophages

Affiliations

Neuroprotection and progenitor cell renewal in the injured adult murine retina requires healing monocyte-derived macrophages

Anat London et al. J Exp Med. .

Abstract

The death of retinal ganglion cells (RGCs) is a hallmark of many retinal neuropathies. Neuroprotection, axonal regeneration, and cell renewal are vital for the integrity of the visual system after insult but are scarce in the adult mammalian retina. We hypothesized that monocyte-derived macrophages, known to promote healing in peripheral tissues, are required after an insult to the visual system, where their role has been largely overlooked. We found that after glutamate eye intoxication, monocyte-derived macrophages infiltrated the damaged retina of mice. Inhibition of this infiltration resulted in reduced survival of RGCs and diminished numbers of proliferating retinal progenitor cells (RPCs) in the ciliary body. Enhancement of the circulating monocyte pool led to increased RGC survival and RPC renewal. The infiltrating monocyte-derived macrophages skewed the milieu of the injured retina toward an antiinflammatory and neuroprotective one and down-regulated accumulation of other immune cells, thereby resolving local inflammation. The beneficial effect on RGC survival depended on expression of interleukin 10 and major histocompatibility complex class II molecules by monocyte-derived macrophages. Thus, we attribute to infiltrating monocyte-derived macrophages a novel role in neuroprotection and progenitor cell renewal in the injured retina, with far-reaching potential implications to retinal neuropathies and other neurodegenerative disorders.


Figures
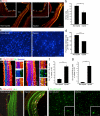
Figure 1.
Figure 1.
Recruitment and activation of innate immune cells after insult to the inner retina. RGCs were quantified in noninjured and injured retinas 7 d after glutamate intoxication (a–d). (a and b) Brn3a+ RGCs, red (bar, 500 µm). Insets show higher magnification (bar, 100 µm). Arrows indicate Brn3a+ cells. n = 3 per group. Data shown are representative of three independent experiments. (c and d) Retrogradely Fluoro-Gold–labeled RGCs, blue (bar, 50 µm). n = 3–4 per group. Data shown are representative of five independent experiments. (e and f) Immunohistochemical analysis of noninjured and injured retinal sections from Cx3cr1GFP/+ mice. CX3CR1, red; myeloid activation marker IB-4, green; Hoechst, blue (bar, 200 µm). Insets show higher magnification of representative CX3CR1-GFP+ myeloid cells (bar, 100 µm). Bar graphs show quantification of CX3CR1-GFP+IB4+ myeloid cells in noninjured and injured retinas. n = 3 per group. (g and h) Immunohistochemical analysis of noninjured and injured retinal sections from CD11cGFP/+ mice. CD11c-GFP, red; IB-4, green (bar, 200 µm). Arrows indicate double-labeled cells. Bar graphs show quantification of CD11c+IB-4+ cells in noninjured and injured retinas. n = 3 per group. Data shown are representative of two independent experiments. (i) Confocal imaging of noninjured and injured flat-mount retinas from Cx3cr1GFP/+ mice (bar, 100 µm). Insets show higher magnification of representative cells (bar, 10 µm). ONL, outer nuclear layer; OPL, outer plexiform layer; INL, inner nuclear layer. Bar graphs throughout figure show mean ± SE of each group. *, P < 0.05; **, P < 0.01; ***, P < 0.001.
Figure 2.
Figure 2.
Appearance of a distinct innate immune cell population after insult in models of glutamate intoxication and elevated IOP. Flow cytometric analysis of noninjured and injured retinas from Cx3cr1GFP/+ mice for Ly6C and CX3CR1-GFP expression on CD11b+ myeloid cells. Cells in dot plots to the right are gated on the CD11b+CX3CR1-GFP+ population (a–d). (a) Note the appearance of the CX3CR1-GFPintLy6C+ population exclusively in the injured retina. (b) Relative contribution of distinct innate immune populations at different time points after glutamate intoxication. n = 3 per group. Bar graphs show mean ± SE of each group. Data shown are representative of two independent experiments. Asterisks above bars indicate significant differences compared with noninjured retina; significant differences between different time points are indicated by asterisks between bars. (c and d) Flow cytometric analysis in the elevated IOP model (pooled data of three animals per group per time point). *, P < 0.05; **, P < 0.01; ***, P < 0.001.
Figure 3.
Figure 3.
Monocyte-derived macrophages infiltrate the retina after injury. [Cx3cr1GFP/+ > WT] BM chimeric mice were generated and subjected to glutamate intoxication, as described in Materials and methods, and their retinas were analyzed for the presence of infiltrating monocyte-derived macrophages (a–g). (a) Immunohistochemical analysis of retinal sections for activated infiltrating monocyte-derived macrophages. CX3CR1-GFP, red; IB-4, green (bar, 50 µm). Arrows indicate double-labeled cells. (b) Live imaging of noninjured and injured retinas. Blood vessels were labeled with dextran rhodamine, red. Insets show flat mounts of live-imaged retinas (bar, 50 µm). (c and d) Representative dot plots and their quantitative analysis showing the kinetics of monocyte-derived macrophage infiltration (CD11b+CX3CR1-GFP+) after the insult. (e and f) Changes in CX3CR1-GFP mean fluorescence intensity of the infiltrating monocyte-derived macrophages at different time points after injury. c–f: n = 3 per group, per time point. Data shown are representative of two independent experiments. Asterisks above bars indicate significant differences compared with noninjured retina. Significant differences between time points are indicated by asterisks between bars. (g) Expression of distinct markers by the infiltrating monocyte-derived macrophages in the injured retina. Bars demarcate cells positive for the indicated marker (isotype control, gray). Numbers above bars refer to percentage of cells positive for the indicated marker out of the CD11b+CX3CR1-GFP+ gated population, representing infiltrating monocyte-derived macrophages. A total of six retinas were pooled and tested for the relevant markers. Data shown are representative of two to three independent experiments. Bar graphs throughout figure show mean ± SE of each group. *, P < 0.05; **, P < 0.01; ***, P < 0.001.
Figure 4.
Figure 4.
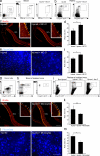
Monocyte-derived macrophages are essential for RGC survival. Glutamate-intoxicated mice were administered the MC-21 antibody and their eyes were analyzed for RGC survival (a–f). (a) Flow cytometric analysis showing the selective depletion of CD115+CD11b+Ly6C+ monocytes in the blood. Numbers indicate the percentage of CD11b+Ly6C+ monocytes out of the total CD115+CD11b+ monocyte population. n = 5 per group. Data shown are representative of six independent experiments. (b) Recruitment of monocyte-derived macrophages (CD11b+CX3CR1-GFP+) to the injured retinas of [Cx3cr1GFP/+ > WT] BM chimeric mice with and without MC-21 treatment. n = 3 per group. Data shown are representative of two independent experiments. (c and d) Representative micrographs of retinas stained for the RGC marker Brn3a (red; bar, 500 µm), and respective quantification of RGC loss in MC-21–treated and untreated injured retinas. n = 5–8 per group. Data are presented as percentage of RGC loss relative to noninjured retina. Insets show higher magnification of representative Brn3a+ RGCs (bar, 100 µm). Arrows indicate Brn3a+ cells. (e and f) Representative micrographs of RGCs in MC-21-treated and untreated injured retinas stereotactically labeled with Fluoro-Gold (blue; bar, 50 µm) and quantification of RGC loss. n = 4–6 per group. Data are presented as percentage of RGC loss relative to noninjured retina. (g–m) Injured mice were adoptively transferred with CD115+ monocytes (WT or Cx3Cr1GFP/+) 1 d after injury, and their eyes were analyzed for RGC survival. Flow cytometric analysis showing the Cx3Cr1GFP/+ donor cells (g) and their presence in the blood of recipient mice (h; cells in dot plot to the right are gated on CD11b+CD115+ population). (i) Flow cytometric analysis of adoptively transferred cells (CD11b+CX3CR1-GFP+) in noninjured retinas, and in retinas excised 36 h and 3 d after injury. h and i: n = 3 per group, per time point. (j and k) Representative micrographs of retinas from injured mice with and without monocyte transfer, stained for the RGC marker Brn3a (red; bar, 500 µm) and respective quantification. n = 4 per group, Data are presented as percentage of RGC loss relative to noninjured retina. Insets show higher magnification of representative Brn3a+ RGCs (bar, 100 µm). Arrows indicate Brn3a+ cells. (l and m) Representative micrographs of RGCs in retinas from injured mice with and without monocyte transfer, stereotactically labeled with Fluoro-Gold (blue; bar, 50 µm), and quantification of RGC loss. n = 4 per group. Data are presented as percentage of RGC loss relative to noninjured retina. Data shown are representative of two independent experiments. Bar graphs throughout figure show mean ± SE of each group. *, P < 0.05; **, P < 0.01.
Figure 5.
Figure 5.
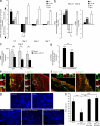
Monocyte-derived macrophages contribute to the neuroprotective and antiinflammatory retinal milieu. (a) Changes in mRNA transcript levels of a series of cytokines in injured compared with noninjured retinas, as a function of time after the insult. (b) Changes in the mRNA transcript levels of various cytokines after MC-21 treatment, compared with injured untreated (left) and noninjured (right) retina. (c) Changes in mRNA levels of additional factors in the injured retina at day 2 after injury, with and without MC-21 treatment, presented relative to noninjured retina. (d) Changes in mRNA transcript levels of cntf at day 2 after injury, after MC-21 treatment, presented relative to noninjured retina. In a–d, a fold change of 1 indicates no change relative to the relevant control. The numbers situated above 1 indicate a fold increase, whereas the numbers below 1 indicate a fold decrease (values presented on a logarithmic scale). For all experiments, n = 3–6 per group, per time point. Data shown are representative of one to two independent experiments. Asterisks above bars represent statistical significance compared with the relevant control. In c and d, asterisks between bars represent statistical significance with respect to the MC-21 treatment. (e) Representative micrographs of retinas from day 2 after injury, showing the expression of TGF-β (red, left) and IL-10 (red, right) by activated IB-4+ myeloid cells (green; bar, 50 µm). Insets show higher magnification of representative double-labeled cells (bar, 5 µm). (f) Representative micrographs of retinas from [Cx3cr1GFP/+ > WT] BM chimeras on day 2 after injury, showing the expression of TGF-β (red, left) and IL-10 (red, right) by infiltrating GFP+ monocyte-derived macrophages (green; bar, 50 µm). Insets show higher magnification of representative double-labeled cells (bar, 5 µm). (g and h) Representative micrographs of Fluoro-Gold–labeled retinas (blue; bar, 50 µm) from noninjured and injured mice without monocyte transfer and from injured mice adoptively transferred with WT, IL-10–deficient, or MHC-II–deficient monocytes. Bar graph shows quantification of RGC loss in the various groups. n = 4–6 per group. Data are presented as percentage of RGC loss relative to noninjured retina. Bar graphs throughout figure show mean ± SE of each group. *, P < 0.05; **, P < 0.01; ***, P < 0.001.
Figure 6.
Figure 6.
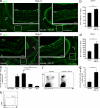
Monocyte-derived macrophages regulate the accumulation of other immune cells in the injured retina. (a–d) Representative micrographs showing activated IB-4+ cells (green; bars, 500 µm) in injured retinas at days 4 and 7 after injury from mice treated with MC-21 compared with untreated injured mice, and respective quantification. n = 3–5 per group. Insets show higher magnification (bars, 50 µm). Arrows indicate GCL. (e) Quantitative analysis showing the kinetics of neutrophil (CD11b+CX3CR1-GFP) accumulation after insult in Cx3cr1GFP/+ transgenic mice. n = 2–3 per time point. Asterisks above bars indicate significant differences compared with noninjured retina. Significant differences between time points are indicated by asterisks between bars. (f and g) Flow cytometric analysis and respective quantification, showing the effect of monocyte depletion on neutrophil (CD11b+CX3CR1-GFP) accumulation after insult. n = 3–5 per group. Data shown are representative of two independent experiments. (h) Representative histogram demonstrating the expression of the Ly6G granulocytic marker by CD11b+CX3CR1-GFP neutrophils in the injured retina. Bar graphs throughout figure show mean ± SE of each group. *, P < 0.05; **, P < 0.01; ***, P < 0.001.
Figure 7.
Figure 7.
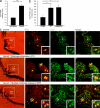
Activation of the quiescent progenitor niche in the adult CB after insult. (a) mRNA levels of egfr in noninjured and injured retina. n = 3–5 per group. Data shown are representative of two independent experiments. (b and c) Injured and noninjured mice were subjected to a BrdU regimen to label proliferating cells. (b) Quantification of proliferating RPCs (BrdU+Pax6+) in the glutamate intoxication (GT) and elevated IOP models. n = 4–6 per group. Data shown are representative of one (elevated IOP) or two (GT) independent experiments. (c) Representative micrographs of CBs of control (top), glutamate-intoxicated (middle), and elevated IOP (bottom) eyes stained for the cell proliferation marker BrdU (red) and the neural/retinal progenitor marker Pax6 (green; bars, 200 µm in the left column and 100 µm in the other columns). Arrows indicate double-labeled cells. Insets show higher magnification of representative proliferating RPCs (bar, 10 µm). Bar graphs throughout the figure show mean ± SE of each group. * P < 0.05, *** P < 0.001.
Figure 8.
Figure 8.
Monocyte-derived macrophages contribute to RPC renewal in the CB of injured adult retina. (a–d) Glutamate-intoxicated mice were either treated with the MC-21 antibody or adoptively transferred with CD115+ monocytes, and their eyes were analyzed for progenitor cell renewal by staining for the cell proliferation marker BrdU (red) and the neural/retinal progenitor marker Pax6 (green). (a and b) Representative micrographs and respective quantification of BrdU+Pax6+ cells in CBs of injured mice with and without MC-21 treatment (bars, 100 µm). n = 5–6 per group. Data shown are representative of two independent experiments. (c and d) Representative micrographs and respective quantification of BrdU+Pax6+ cells in CBs of adoptively transferred and untreated injured mice (bar, 100 µm). n = 3 per group. Throughout the figure, arrows indicate double-labeled cells; insets show higher magnification of representative proliferating RPCs (bar, 10 µm); and bar graphs show mean ± SE of each group. *, P < 0.05.

Similar articles

Cited by

References

    1. Ahmad I., Tang L., Pham H. 2000. Identification of neural progenitors in the adult mammalian eye. Biochem. Biophys. Res. Commun. 270:517–521 10.1006/bbrc.2000.2473 - DOI - PubMed
    1. Alvarado J.A., Katz L.J., Trivedi S., Shifera A.S. 2010. Monocyte modulation of aqueous outflow and recruitment to the trabecular meshwork following selective laser trabeculoplasty. Arch. Ophthalmol. 128:731–737 10.1001/archophthalmol.2010.85 - DOI - PubMed
    1. Anchan R.M., Reh T.A., Angello J., Balliet A., Walker M. 1991. EGF and TGF-alpha stimulate retinal neuroepithelial cell proliferation in vitro. Neuron. 6:923–936 10.1016/0896-6273(91)90233-P - DOI - PubMed
    1. Andrews D.M., Matthews V.B., Sammels L.M., Carrello A.C., McMinn P.C. 1999. The severity of murray valley encephalitis in mice is linked to neutrophil infiltration and inducible nitric oxide synthase activity in the central nervous system. J. Virol. 73:8781–8790 - PMC - PubMed
    1. Arnold L., Henry A., Poron F., Baba-Amer Y., van Rooijen N., Plonquet A., Gherardi R.K., Chazaud B. 2007. Inflammatory monocytes recruited after skeletal muscle injury switch into antiinflammatory macrophages to support myogenesis. J. Exp. Med. 204:1057–1069 10.1084/jem.20070075 - DOI - PMC - PubMed

Publication types