Dynamic changes in the copy number of pluripotency and cell proliferation genes in human ESCs and iPSCs during reprogramming and time in culture
- PMID: 21211785
- PMCID: PMC3043464
- DOI: 10.1016/j.stem.2010.12.003
Dynamic changes in the copy number of pluripotency and cell proliferation genes in human ESCs and iPSCs during reprogramming and time in culture
Abstract
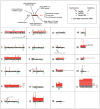
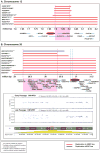
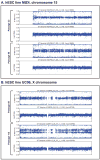
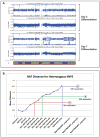
Genomic stability is critical for the clinical use of human embryonic and induced pluripotent stem cells. We performed high-resolution SNP (single-nucleotide polymorphism) analysis on 186 pluripotent and 119 nonpluripotent samples. We report a higher frequency of subchromosomal copy number variations in pluripotent samples compared to nonpluripotent samples, with variations enriched in specific genomic regions. The distribution of these variations differed between hESCs and hiPSCs, characterized by large numbers of duplications found in a few hESC samples and moderate numbers of deletions distributed across many hiPSC samples. For hiPSCs, the reprogramming process was associated with deletions of tumor-suppressor genes, whereas time in culture was associated with duplications of oncogenic genes. We also observed duplications that arose during a differentiation protocol. Our results illustrate the dynamic nature of genomic abnormalities in pluripotent stem cells and the need for frequent genomic monitoring to assure phenotypic stability and clinical safety.
Copyright © 2011 Elsevier Inc. All rights reserved.
Figures

Comment in
-
iPSCs: induced back to controversy.Cell Stem Cell. 2011 Apr 8;8(4):347-8. doi: 10.1016/j.stem.2011.03.003. Cell Stem Cell. 2011. PMID: 21474093
Similar articles
-
Strategy to Establish Embryo-Derived Pluripotent Stem Cells in Cattle.Int J Mol Sci. 2021 May 9;22(9):5011. doi: 10.3390/ijms22095011. Int J Mol Sci. 2021. PMID: 34065074 Free PMC article. Review.
-
Concise Review: Molecular Cytogenetics and Quality Control: Clinical Guardians for Pluripotent Stem Cells.Stem Cells Transl Med. 2018 Dec;7(12):867-875. doi: 10.1002/sctm.18-0087. Epub 2018 Sep 14. Stem Cells Transl Med. 2018. PMID: 30218497 Free PMC article. Review.
-
Cytoskeletal Expression and Remodeling in Pluripotent Stem Cells.PLoS One. 2016 Jan 15;11(1):e0145084. doi: 10.1371/journal.pone.0145084. eCollection 2016. PLoS One. 2016. PMID: 26771179 Free PMC article.
-
Platform for induction and maintenance of transgene-free hiPSCs resembling ground state pluripotent stem cells.Stem Cell Reports. 2014 Mar 6;2(3):366-81. doi: 10.1016/j.stemcr.2014.01.014. eCollection 2014 Mar 11. Stem Cell Reports. 2014. PMID: 24672758 Free PMC article.
-
Trib2 regulates the pluripotency of embryonic stem cells and enhances reprogramming efficiency.Exp Mol Med. 2017 Nov 24;49(11):e401. doi: 10.1038/emm.2017.191. Exp Mol Med. 2017. PMID: 29170476 Free PMC article.
Cited by
-
Amniotic fluid stem cells to study mTOR signaling in differentiation.Organogenesis. 2012 Jul-Sep;8(3):96-100. doi: 10.4161/org.22038. Epub 2012 Jul 1. Organogenesis. 2012. PMID: 22960547 Free PMC article. Review.
-
Adipose regeneration and implications for breast reconstruction: update and the future.Gland Surg. 2016 Apr;5(2):227-41. doi: 10.3978/j.issn.2227-684X.2016.01.01. Gland Surg. 2016. PMID: 27047789 Free PMC article. Review.
-
Effects of Integrating and Non-Integrating Reprogramming Methods on Copy Number Variation and Genomic Stability of Human Induced Pluripotent Stem Cells.PLoS One. 2015 Jul 1;10(7):e0131128. doi: 10.1371/journal.pone.0131128. eCollection 2015. PLoS One. 2015. PMID: 26131765 Free PMC article.
-
Human-Induced Pluripotent Stem Cell Culture Methods Under cGMP Conditions.Curr Protoc Stem Cell Biol. 2020 Sep;54(1):e117. doi: 10.1002/cpsc.117. Curr Protoc Stem Cell Biol. 2020. PMID: 32649060 Free PMC article.
-
Neonatal desensitization supports long-term survival and functional integration of human embryonic stem cell-derived mesenchymal stem cells in rat joint cartilage without immunosuppression.Stem Cells Dev. 2013 Jan 1;22(1):90-101. doi: 10.1089/scd.2012.0116. Epub 2012 Aug 14. Stem Cells Dev. 2013. PMID: 22788986 Free PMC article.
References
-
- Atkin NB, Baker MC. Specific chromosome change, i(12p), in testicular tumours? Lancet. 1982;2:1349. - PubMed
-
- Baker DE, Harrison NJ, Maltby E, Smith K, Moore HD, Shaw PJ, Heath PR, Holden H, Andrews PW. Adaptation to culture of human embryonic stem cells and oncogenesis in vivo. Nat Biotechnol. 2007;25:207–215. - PubMed
-
- Boise LH, Gonzalez-Garcia M, Postema CE, Ding L, Lindsten T, Turka LA, Mao X, Nunez G, Thompson CB. bcl-x, a bcl-2-related gene that functions as a dominant regulator of apoptotic cell death. Cell. 1993;74:597–608. - PubMed
-
- Booth HA, Holland PW. Eleven daughters of NANOG. Genomics. 2004;84:229–238. - PubMed
Publication types
MeSH terms
Associated data
- Actions
Grants and funding
LinkOut - more resources
Full Text Sources
Other Literature Sources
Molecular Biology Databases

