

NKG2D expression in CD4+ T lymphocytes as a marker of senescence in the aged immune system
- PMID: 21210234
- PMCID: PMC3220398
- DOI: 10.1007/s11357-010-9200-6
NKG2D expression in CD4+ T lymphocytes as a marker of senescence in the aged immune system
Abstract
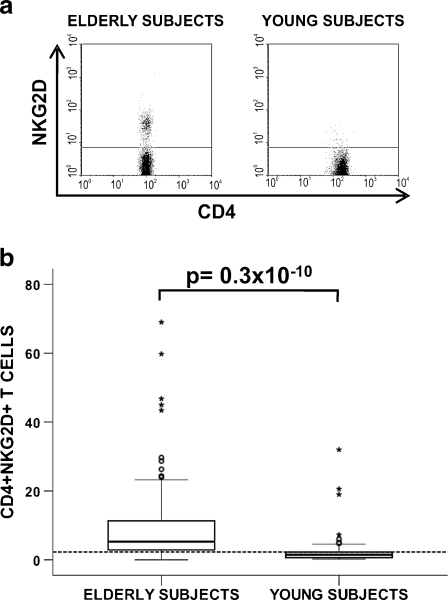
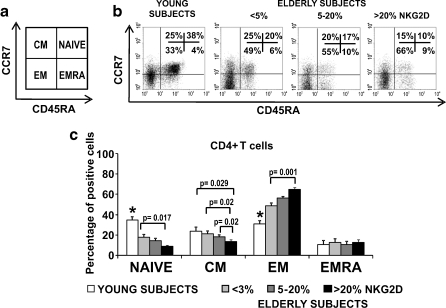
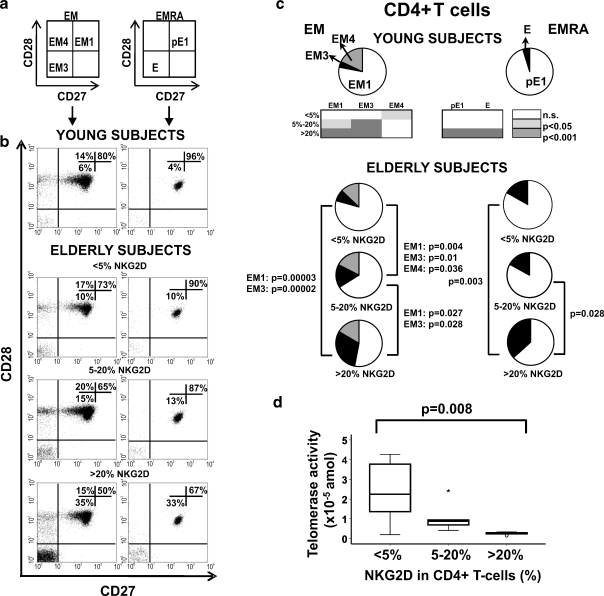
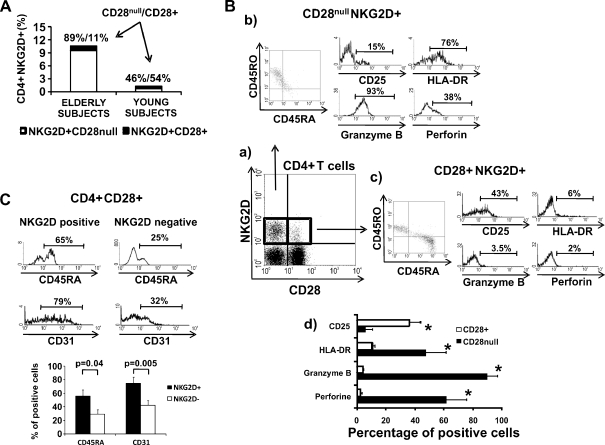
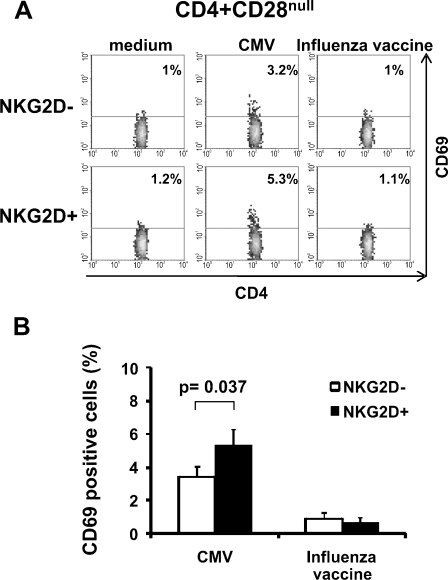
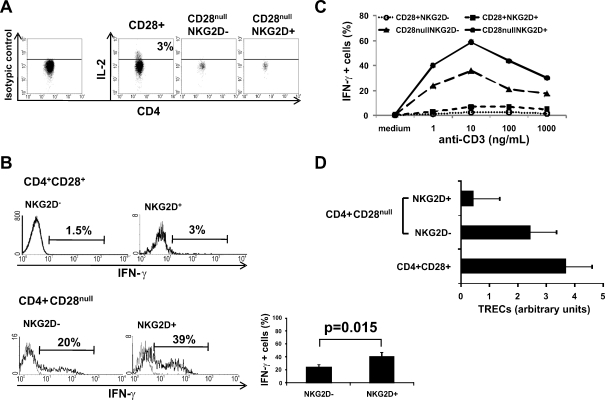
Human aging is characterized by changes in the immune system which have a profound impact on the T-cell compartment. These changes are more frequently found in CD8+ T cells, and there are not well-defined markers of differentiation in the CD4+ subset. Typical features of cell immunosenescence are characteristics of pathologies in which the aberrant expression of NKG2D in CD4+ T cells has been described. To evaluate a possible age-related expression of NKG2D in CD4+ T cells, we compared their percentage in peripheral blood from 100 elderly and 50 young adults. The median percentage of CD4+ NKG2D+ in elders was 5.3% (interquartile range (IR): 8.74%) versus 1.4% (IR: 1.7%) in young subjects (p < 0.3 × 10(-10)). CD28 expression distinguished two subsets of CD4+ NKG2D+ cells with distinct functional properties and differentiation status. CD28+ cells showed an immature phenotype associated with high frequencies of CD45RA and CD31. However, most of the NKG2D+ cells belonged to the CD28(null) compartment and shared their phenotypical properties. NKG2D+ cells represented a more advanced stage of maturation and exhibited greater response to CMV (5.3 ± 3.1% versus 3.4 ± 2%, p = 0.037), higher production of IFN-γ (40.56 ± 13.7% versus 24 ± 8.8%, p = 0.015), lower activation threshold and reduced TREC content. Moreover, the frequency of the CD4+ NKG2D+ subset was clearly related to the status of the T cells. Higher frequencies of the NKG2D+ subset were accompanied with a gradual decrease of NAIVE and central memory cells, but also with a higher level of more differentiated subsets of CD4+ T cells. In conclusion, CD4+ NKG2D+ represent a subset of highly differentiated T cells which characterizes the senescence of the immune system.
Figures
Similar articles
-
Loss of CD28 within CD4+ T cell subsets from cervical cancer patients is accompanied by the acquisition of intracellular perforin, and is further enhanced by NKG2D expression.Immunol Lett. 2017 Feb;182:30-38. doi: 10.1016/j.imlet.2017.01.006. Epub 2017 Jan 10. Immunol Lett. 2017. PMID: 28087292
-
Impact of age, sex and CMV-infection on peripheral T cell phenotypes: results from the Berlin BASE-II Study.Biogerontology. 2015 Oct;16(5):631-43. doi: 10.1007/s10522-015-9563-2. Epub 2015 Mar 3. Biogerontology. 2015. PMID: 25732234
-
Expression and function of NKG2D in CD4+ T cells specific for human cytomegalovirus.Eur J Immunol. 2006 Dec;36(12):3198-206. doi: 10.1002/eji.200636682. Eur J Immunol. 2006. PMID: 17109473
-
The immune system in extreme longevity.Exp Gerontol. 2008 Feb;43(2):61-5. doi: 10.1016/j.exger.2007.06.008. Epub 2007 Jul 4. Exp Gerontol. 2008. PMID: 17870272 Review.
-
NKG2D: A versatile player in the immune system.Immunol Lett. 2017 Sep;189:48-53. doi: 10.1016/j.imlet.2017.04.006. Epub 2017 Apr 13. Immunol Lett. 2017. PMID: 28414183 Review.
Cited by
-
Molecular mechanisms involved in the aging of the T-cell immune response.Curr Genomics. 2012 Dec;13(8):589-602. doi: 10.2174/138920212803759749. Curr Genomics. 2012. PMID: 23730199 Free PMC article.
-
Immunosenescence in renal transplantation: a changing balance of innate and adaptive immunity.Curr Opin Organ Transplant. 2015 Aug;20(4):417-23. doi: 10.1097/MOT.0000000000000210. Curr Opin Organ Transplant. 2015. PMID: 26154914 Free PMC article. Review.
-
T cell aging: a review of the transcriptional changes determined from genome-wide analysis.Front Immunol. 2013 May 20;4:121. doi: 10.3389/fimmu.2013.00121. eCollection 2013. Front Immunol. 2013. PMID: 23730304 Free PMC article.
-
Canine peripheral blood TCRαβ T cell atlas: Identification of diverse subsets including CD8A+ MAIT-like cells by combined single-cell transcriptome and V(D)J repertoire analysis.Front Immunol. 2023 Feb 23;14:1123366. doi: 10.3389/fimmu.2023.1123366. eCollection 2023. Front Immunol. 2023. PMID: 36911660 Free PMC article.
-
Cellular senescence: the good, the bad and the unknown.Nat Rev Nephrol. 2022 Oct;18(10):611-627. doi: 10.1038/s41581-022-00601-z. Epub 2022 Aug 3. Nat Rev Nephrol. 2022. PMID: 35922662 Free PMC article. Review.
References
-
- Allez M, Tieng V, Nakazawa A, Treton X, Pacault V, Dulphy N, Caillat-Zucman S, Paul P, Gornet JM, Douay C, Ravet S, Tamouza R, Charron D, Lemann M, Mayer L, Toubert A. CD4+ NKG2D+ T cells in Crohn’s disease mediate inflammatory and cytotoxic responses through MICA interactions. Gastroenterology. 2007;132:2346–2358. doi: 10.1053/j.gastro.2007.03.025. - DOI - PubMed
-
- Almanzar G, Schwaiger S, Jenewein B, Keller M, Herndler-Brandstetter D, Wurzner R, Schonitzer D, Grubeck-Loebenstein B. Long-term cytomegalovirus infection leads to significant changes in the composition of the CD8+ T-cell repertoire, which may be the basis for an imbalance in the cytokine production profile in elderly persons. J Virol. 2005;79:3675–3683. doi: 10.1128/JVI.79.6.3675-3683.2005. - DOI - PMC - PubMed
-
- Alonso-Arias R, Lopez-Vazquez A, Diaz-Pena R, Sampere A, Tricas L, Asensi V, Rodrigo L, Lopez-Larrea C. CD8dim and NKG2D expression defines related subsets of CD4+ T cells in HIV-infected patients with worse prognostic factors. J Acquir Immune Defic Syndr. 2009;51:390–398. doi: 10.1097/FTD.0b013e3181679015. - DOI - PubMed
Publication types
MeSH terms
Substances
LinkOut - more resources
Full Text Sources
Other Literature Sources
Medical
Research Materials