Nox2 redox signaling maintains essential cell populations in the brain
- PMID: 21186346
- PMCID: PMC3023843
- DOI: 10.1038/nchembio.497
Nox2 redox signaling maintains essential cell populations in the brain
Abstract
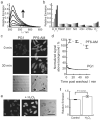
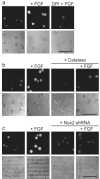
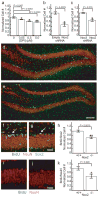
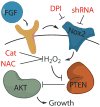
Reactive oxygen species (ROS) are conventionally classified as toxic consequences of aerobic life, and the brain is particularly susceptible to ROS-induced oxidative stress and damage owing to its high energy and oxygen demands. NADPH oxidases (Nox) are a widespread source of brain ROS implicated in seizures, stroke and neurodegeneration. A physiological role for ROS generation in normal brain function has not been established, despite the fact that mice and humans lacking functional Nox proteins have cognitive deficits. Using molecular imaging with Peroxyfluor-6 (PF6), a new selective fluorescent indicator for hydrogen peroxide (H(2)O(2)), we show that adult hippocampal stem/progenitor cells (AHPs) generate H(2)O(2) through Nox2 to regulate intracellular growth signaling pathways, which in turn maintains their normal proliferation in vitro and in vivo. Our results challenge the traditional view that brain ROS are solely deleterious by demonstrating that controlled ROS chemistry is needed for maintaining specific cell populations.
Figures


Similar articles
-
Boronate oxidation as a bioorthogonal reaction approach for studying the chemistry of hydrogen peroxide in living systems.Acc Chem Res. 2011 Sep 20;44(9):793-804. doi: 10.1021/ar200126t. Epub 2011 Aug 11. Acc Chem Res. 2011. PMID: 21834525 Free PMC article.
-
ROS-induced ROS release orchestrated by Nox4, Nox2, and mitochondria in VEGF signaling and angiogenesis.Am J Physiol Cell Physiol. 2017 Jun 1;312(6):C749-C764. doi: 10.1152/ajpcell.00346.2016. Epub 2017 Apr 19. Am J Physiol Cell Physiol. 2017. PMID: 28424170 Free PMC article.
-
Oxidants in Physiological Processes.Handb Exp Pharmacol. 2021;264:27-47. doi: 10.1007/164_2020_380. Handb Exp Pharmacol. 2021. PMID: 32767144 Review.
-
Redox regulation of Nox proteins.Respir Physiol Neurobiol. 2010 Dec 31;174(3):265-71. doi: 10.1016/j.resp.2010.09.016. Epub 2010 Sep 29. Respir Physiol Neurobiol. 2010. PMID: 20883826 Free PMC article. Review.
-
NOX Inhibitors: From Bench to Naxibs to Bedside.Handb Exp Pharmacol. 2021;264:145-168. doi: 10.1007/164_2020_387. Handb Exp Pharmacol. 2021. PMID: 32780287
Cited by
-
NADPH-oxidase 2 activation promotes opioid-induced antinociceptive tolerance in mice.Neuroscience. 2013 Jun 25;241:1-9. doi: 10.1016/j.neuroscience.2013.02.042. Epub 2013 Feb 27. Neuroscience. 2013. PMID: 23454539 Free PMC article.
-
Versatile Histochemical Approach to Detection of Hydrogen Peroxide in Cells and Tissues Based on Puromycin Staining.J Am Chem Soc. 2018 May 16;140(19):6109-6121. doi: 10.1021/jacs.8b02279. Epub 2018 May 3. J Am Chem Soc. 2018. PMID: 29722974 Free PMC article.
-
Multiparametric optical analysis of mitochondrial redox signals during neuronal physiology and pathology in vivo.Nat Med. 2014 May;20(5):555-60. doi: 10.1038/nm.3520. Epub 2014 Apr 20. Nat Med. 2014. PMID: 24747747
-
Decreased neural precursor cell pool in NADPH oxidase 2-deficiency: From mouse brain to neural differentiation of patient derived iPSC.Redox Biol. 2017 Oct;13:82-93. doi: 10.1016/j.redox.2017.04.026. Epub 2017 Apr 24. Redox Biol. 2017. PMID: 28575744 Free PMC article.
-
Interdependence between EGFR and Phosphatases Spatially Established by Vesicular Dynamics Generates a Growth Factor Sensing and Responding Network.Cell Syst. 2018 Sep 26;7(3):295-309.e11. doi: 10.1016/j.cels.2018.06.006. Epub 2018 Aug 22. Cell Syst. 2018. PMID: 30145116 Free PMC article.
References
-
- Floyd RA. Oxidative damage to behavior during aging. Science. 1991;254:1597–1597. - PubMed
-
- Andersen JK. Oxidative stress in neurodegeneration: cause or consequence? Nature Med. 2004;10:S18–25. - PubMed
-
- Bedard K, Krause KH. The NOX family of ROS-generating NADPH oxidases: physiology and pathophysiology. Physiol Rev. 2007;87:245–313. - PubMed
-
- Lambeth JD. NOX enzymes and the biology of reactive oxygen. Nat Rev Immunol. 2004;4:181–189. - PubMed
Publication types
MeSH terms
Associated data
Grants and funding
LinkOut - more resources
Full Text Sources
Other Literature Sources
Miscellaneous

