A fluorescence reporter model defines "Tip-DCs" as the cellular source of interferon β in murine listeriosis
- PMID: 21179567
- PMCID: PMC3002951
- DOI: 10.1371/journal.pone.0015567
A fluorescence reporter model defines "Tip-DCs" as the cellular source of interferon β in murine listeriosis
Abstract
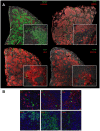
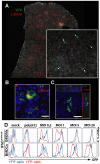
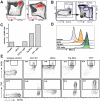
Production of type I interferons, consisting mainly of multiple IFNα subtypes and IFNβ, represents an essential part of the innate immune defense against invading pathogens. While in most situations, namely viral infections, this class of cytokines is indispensable for host survival they mediate a detrimental effect during infection with L. monocytogenes by rendering macrophages insensitive towards IFNγ signalling which leads to a lethal bacterial pathology in mice. Due to a lack of suitable analytic tools the precise identity of the cell population responsible for type I IFN production remains ill-defined and so far these cells have been described to be macrophages. As in general IFNβ is the first type I interferon to be produced, we took advantage of an IFNβ fluorescence reporter-knockin mouse model in which YFP is expressed from a bicistronic mRNA linked by an IRES to the endogenous ifnb mRNA to assess the IFNβ production on a single cell level in situ. Our results showed highest frequencies and absolute numbers of IFNβ+ cells in the spleen 24 h after infection with L. monocytogenes where they were located predominately in the white pulp within the foci of infection. Detailed FACS surface marker analyses, intracellular cytokine stainings and T cell proliferation assays revealed that the IFNβ+ cells were a phenotypically and functionally further specialized subpopulation of TNF and iNOS producing DCs (Tip-DCs) which are known to be essential for the early containment of L. monocytogenes infection. We proved that the IFNβ+ cells exhibited the hallmark characteristics of Tip-DCs as they produced iNOS and TNF and possessed T cell priming abilities. These results point to a yet unappreciated ambiguous role for a multi-effector, IFNβ producing subpopulation of Tip-DCs in controlling the balance between containment of L. monocytogenes infection and effects detrimental to the host driven by IFNβ.
Conflict of interest statement
Figures


Similar articles
-
The timing of IFNβ production affects early innate responses to Listeria monocytogenes and determines the overall outcome of lethal infection.PLoS One. 2012;7(8):e43455. doi: 10.1371/journal.pone.0043455. Epub 2012 Aug 17. PLoS One. 2012. PMID: 22912878 Free PMC article.
-
Characterization of the interferon-producing cell in mice infected with Listeria monocytogenes.PLoS Pathog. 2009 Mar;5(3):e1000355. doi: 10.1371/journal.ppat.1000355. Epub 2009 Mar 27. PLoS Pathog. 2009. PMID: 19325882 Free PMC article.
-
MyD88 and interferon-alpha/beta are differentially required for dendritic cell maturation but dispensable for development of protective memory against Listeria.Immunology. 2009 Nov;128(3):429-38. doi: 10.1111/j.1365-2567.2009.03128.x. Immunology. 2009. PMID: 20067542 Free PMC article.
-
Antagonistic crosstalk between type I and II interferons and increased host susceptibility to bacterial infections.Virulence. 2010 Sep-Oct;1(5):418-22. doi: 10.4161/viru.1.5.12787. Virulence. 2010. PMID: 21178482 Free PMC article. Review.
-
Context Is Key: Delineating the Unique Functions of IFNα and IFNβ in Disease.Front Immunol. 2020 Dec 21;11:606874. doi: 10.3389/fimmu.2020.606874. eCollection 2020. Front Immunol. 2020. PMID: 33408718 Free PMC article. Review.
Cited by
-
Herpes virus entry mediator licenses Listeria infection induced immunopathology through control of type I interferon.Sci Rep. 2015 Aug 6;5:12954. doi: 10.1038/srep12954. Sci Rep. 2015. PMID: 26245828 Free PMC article.
-
STING/MPYS mediates host defense against Listeria monocytogenes infection by regulating Ly6C(hi) monocyte migration.J Immunol. 2013 Mar 15;190(6):2835-43. doi: 10.4049/jimmunol.1201788. Epub 2013 Feb 1. J Immunol. 2013. PMID: 23378430 Free PMC article.
-
Type I and III Interferon in the Gut: Tight Balance between Host Protection and Immunopathology.Front Immunol. 2017 Mar 14;8:258. doi: 10.3389/fimmu.2017.00258. eCollection 2017. Front Immunol. 2017. PMID: 28352268 Free PMC article. Review.
-
IFNβ secreted by microglia mediates clearance of myelin debris in CNS autoimmunity.Acta Neuropathol Commun. 2015 Apr 3;3:20. doi: 10.1186/s40478-015-0192-4. Acta Neuropathol Commun. 2015. PMID: 25853624 Free PMC article.
-
Type I interferons: diversity of sources, production pathways and effects on immune responses.Curr Opin Virol. 2011 Dec;1(6):463-75. doi: 10.1016/j.coviro.2011.10.026. Epub 2011 Nov 25. Curr Opin Virol. 2011. PMID: 22440910 Free PMC article.
References
-
- Hamon M, Bierne H, Cossart P. Listeria monocytogenes: a multifaceted model. Nat Rev Microbiol. 2006;4:423–434. - PubMed
-
- Pamer EG. Immune responses to Listeria monocytogenes. Nat Rev Immunol. 2004;4:812–823. - PubMed
-
- Decker T, Muller M, Stockinger S. The yin and yang of type I interferon activity in bacterial infection. Nat Rev Immunol. 2005;5:675–687. - PubMed
Publication types
MeSH terms
Substances
LinkOut - more resources
Full Text Sources
Medical
Research Materials

