Cortical representations of olfactory input by trans-synaptic tracing
- PMID: 21179085
- PMCID: PMC3073090
- DOI: 10.1038/nature09714
Cortical representations of olfactory input by trans-synaptic tracing
Abstract
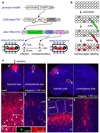
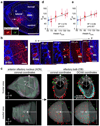
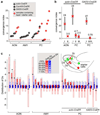
In the mouse, each class of olfactory receptor neurons expressing a given odorant receptor has convergent axonal projections to two specific glomeruli in the olfactory bulb, thereby creating an odour map. However, it is unclear how this map is represented in the olfactory cortex. Here we combine rabies-virus-dependent retrograde mono-trans-synaptic labelling with genetics to control the location, number and type of 'starter' cortical neurons, from which we trace their presynaptic neurons. We find that individual cortical neurons receive input from multiple mitral cells representing broadly distributed glomeruli. Different cortical areas represent the olfactory bulb input differently. For example, the cortical amygdala preferentially receives dorsal olfactory bulb input, whereas the piriform cortex samples the whole olfactory bulb without obvious bias. These differences probably reflect different functions of these cortical areas in mediating innate odour preference or associative memory. The trans-synaptic labelling method described here should be widely applicable to mapping connections throughout the mouse nervous system.
Figures


Similar articles
-
Distinct representations of olfactory information in different cortical centres.Nature. 2011 Apr 14;472(7342):213-6. doi: 10.1038/nature09868. Epub 2011 Mar 30. Nature. 2011. PMID: 21451525 Free PMC article.
-
Olfactory neuroscience: beyond the bulb.Curr Biol. 2011 Jun 7;21(11):R438-40. doi: 10.1016/j.cub.2011.04.036. Curr Biol. 2011. PMID: 21640905
-
Sensory maps in the olfactory cortex defined by long-range viral tracing of single neurons.Nature. 2011 Apr 14;472(7342):217-20. doi: 10.1038/nature09945. Epub 2011 Mar 30. Nature. 2011. PMID: 21451523
-
The olfactory bulb: coding and processing of odor molecule information.Science. 1999 Oct 22;286(5440):711-5. doi: 10.1126/science.286.5440.711. Science. 1999. PMID: 10531048 Review.
-
Neural and behavioral mechanisms of olfactory perception.Curr Opin Neurobiol. 2008 Aug;18(4):408-12. doi: 10.1016/j.conb.2008.08.015. Epub 2008 Oct 8. Curr Opin Neurobiol. 2008. PMID: 18809492 Free PMC article. Review.
Cited by
-
The neural circuits of innate fear: detection, integration, action, and memorization.Learn Mem. 2016 Sep 15;23(10):544-55. doi: 10.1101/lm.042812.116. Print 2016 Oct. Learn Mem. 2016. PMID: 27634145 Free PMC article. Review.
-
Extensions of MADM (mosaic analysis with double markers) in mice.PLoS One. 2012;7(3):e33332. doi: 10.1371/journal.pone.0033332. Epub 2012 Mar 27. PLoS One. 2012. PMID: 22479386 Free PMC article.
-
Enhancing GABAergic signaling ameliorates aberrant gamma oscillations of olfactory bulb in AD mouse models.Mol Neurodegener. 2021 Mar 4;16(1):14. doi: 10.1186/s13024-021-00434-7. Mol Neurodegener. 2021. PMID: 33663578 Free PMC article.
-
Cell type-specific long-range connections of basal forebrain circuit.Elife. 2016 Sep 19;5:e13214. doi: 10.7554/eLife.13214. Elife. 2016. PMID: 27642784 Free PMC article.
-
Revealing the secrets of neuronal circuits with recombinant rabies virus technology.Front Neural Circuits. 2013 Jan 24;7:2. doi: 10.3389/fncir.2013.00002. eCollection 2013. Front Neural Circuits. 2013. PMID: 23355811 Free PMC article. Review.
References
-
- Cowan WM. The emergence of modern neuroanatomy and developmental neurobiology. Neuron. 1998;20:413–426. - PubMed
-
- Ugolini G. Specificity of rabies virus as a transneuronal tracer of motor networks: transfer from hypoglossal motoneurons to connected second-order and higher order central nervous system cell groups. J Comp Neurol. 1995;356(3):457–480. - PubMed
-
- Ugolini G. Advances in viral transneuronal tracing. J Neurosci Methods. 2010 - PubMed
Publication types
MeSH terms
Grants and funding
LinkOut - more resources
Full Text Sources
Other Literature Sources
Molecular Biology Databases
Research Materials

