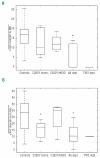
A time course of hepcidin response to iron challenge in patients with HFE and TFR2 hemochromatosis
- PMID: 21173098
- PMCID: PMC3069225
- DOI: 10.3324/haematol.2010.033449
A time course of hepcidin response to iron challenge in patients with HFE and TFR2 hemochromatosis
Abstract
Background: Inadequate hepcidin production leads to iron overload in nearly all types of hemochromatosis. We explored the acute response of hepcidin to iron challenge in 25 patients with HFE-hemochromatosis, in two with TFR2-hemochromatosis and in 13 controls. Sixteen patients (10 C282Y/C282Y homozygotes, 6 C282Y/H63D compound heterozygotes) had increased iron stores, while nine (6 C282Y/C282Y homozygotes, 3 C282Y/H63D compound heterozygotes) were studied after phlebotomy-induced normalization of iron stores.
Design and methods: We analyzed serum iron, transferrin saturation, and serum hepcidin by both enzyme-linked immunosorbent assay and mass-spectrometry at baseline, and 4, 8, 12 and 24 hours after a single 65-mg dose of oral iron.
Results: Serum iron and transferrin saturation significantly increased at 4 hours and returned to baseline values at 8-12 hours in all groups, except in the iron-normalized patients who showed the highest and longest increase of both parameters. The level of hepcidin increased significantly at 4 hours and returned to baseline at 24 hours in controls and in the C282Y/H63D compound heterozygotes at diagnosis. The hepcidin response was smaller in C282Y-homozygotes than in controls, barely detectable in the patients with iron-depleted HFE-hemochromatosis and absent in those with TFR2-hemochromatosis. Conclusions Our results are consistent with a scenario in which TFR2 plays a prominent and HFE a contributory role in the hepcidin response to a dose of oral iron. In iron-normalized patients with HFE hemochromatosis, both the low baseline hepcidin level and the weak response to iron contribute to hyperabsorption of iron.
Figures


Comment in
-
Novel observations in hereditary hemochromatosis: potential implications for clinical strategies.Haematologica. 2011 Apr;96(4):485-8. doi: 10.3324/haematol.2011.042036. Haematologica. 2011. PMID: 21454877 Free PMC article. No abstract available.
Similar articles
-
Blunted increase in serum hepcidin as response to oral iron in HFE-hemochromatosis.Eur J Gastroenterol Hepatol. 2011 Aug;23(8):721-4. doi: 10.1097/MEG.0b013e3283484716. Eur J Gastroenterol Hepatol. 2011. PMID: 21654321
-
Blunted hepcidin response to oral iron challenge in HFE-related hemochromatosis.Blood. 2007 Dec 1;110(12):4096-100. doi: 10.1182/blood-2007-06-096503. Epub 2007 Aug 27. Blood. 2007. PMID: 17724144
-
Measurement of urinary hepcidin levels by SELDI-TOF-MS in HFE-hemochromatosis.Blood Cells Mol Dis. 2008 May-Jun;40(3):347-52. doi: 10.1016/j.bcmd.2007.10.001. Epub 2007 Dec 27. Blood Cells Mol Dis. 2008. PMID: 18164223
-
[Pathophysiology and genetics of classic HFE (type 1) hemochromatosis].Presse Med. 2007 Sep;36(9 Pt 2):1271-7. doi: 10.1016/j.lpm.2007.03.038. Epub 2007 May 22. Presse Med. 2007. PMID: 17521857 Review. French.
-
[Non-HFE-related hereditary iron overload].Presse Med. 2007 Sep;36(9 Pt 2):1279-91. doi: 10.1016/j.lpm.2007.01.042. Epub 2007 May 30. Presse Med. 2007. PMID: 17540536 Review. French.
Cited by
-
Clinical Immunoassay for Human Hepcidin Predicts Iron Deficiency in First-Time Blood Donors.J Appl Lab Med. 2020 Sep 1;5(5):943-953. doi: 10.1093/jalm/jfaa038. J Appl Lab Med. 2020. PMID: 32674118 Free PMC article.
-
Hepcidin and Iron in Health and Disease.Annu Rev Med. 2023 Jan 27;74:261-277. doi: 10.1146/annurev-med-043021-032816. Epub 2022 Jul 29. Annu Rev Med. 2023. PMID: 35905974 Free PMC article. Review.
-
Regulation of cell surface transferrin receptor-2 by iron-dependent cleavage and release of a soluble form.Haematologica. 2015 Apr;100(4):458-65. doi: 10.3324/haematol.2014.118521. Epub 2015 Jan 30. Haematologica. 2015. PMID: 25637053 Free PMC article.
-
Clinical experience with the use of ferric citrate as a phosphate binder in pediatric dialysis patients.Pediatr Nephrol. 2018 Nov;33(11):2137-2142. doi: 10.1007/s00467-018-3999-y. Epub 2018 Jun 28. Pediatr Nephrol. 2018. PMID: 29956006 Free PMC article.
-
Relationship of Baseline Hemoglobin Level with Serum Ferritin, Postphlebotomy Hemoglobin Changes, and Phlebotomy Requirements among HFE C282Y Homozygotes.Biomed Res Int. 2015;2015:241784. doi: 10.1155/2015/241784. Epub 2015 Aug 26. Biomed Res Int. 2015. PMID: 26380265 Free PMC article.
References
-
- Camaschella C. Understanding iron homeostasis through genetic analysis of haemochromatosis and related disorders. Blood. 2005;106(12):3710–7. - PubMed
-
- Nemeth E, Tuttle MS, Powelson J, Vaughn MB, Donovan A, Ward DM, et al. Hepcidin regulates cellular iron efflux by binding to ferroportin and inducing its internalization. Science. 2004;306(5704):2090–3. - PubMed
-
- Roetto A, Papanikolaou G, Politou M, Alberti F, Girelli D, Christakis J, et al. Mutant antimicrobial peptide hepcidin is associated with severe juvenile haemochromatosis. Nat Genet. 2003;33(1):21–2. - PubMed
-
- Papanikolaou G, Samuels ME, Ludwig EH, MacDonald ML, Franchini PL, Dubé MP, et al. Mutations in HFE2 cause iron overload in chromosome 1q-linked juvenile haemochromatosis. Nat Genet. 2004;36(1):77–82. - PubMed
-
- Piperno A, Girelli D, Nemeth E, Trombini P, Bozzini C, Poggiali E, et al. Blunted hepcidin response to oral iron challenge in HFE-related haemochromatosis. Blood. 2007;110(12):4096–100. - PubMed
Publication types
MeSH terms
Substances
Grants and funding
LinkOut - more resources
Full Text Sources
Medical
Molecular Biology Databases

