Continuous and periodic expansion of CAG repeats in Huntington's disease R6/1 mice
- PMID: 21170307
- PMCID: PMC3000365
- DOI: 10.1371/journal.pgen.1001242
Continuous and periodic expansion of CAG repeats in Huntington's disease R6/1 mice
Abstract
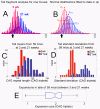
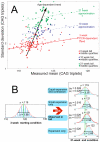
Huntington's disease (HD) is one of several neurodegenerative disorders caused by expansion of CAG repeats in a coding gene. Somatic CAG expansion rates in HD vary between organs, and the greatest instability is observed in the brain, correlating with neuropathology. The fundamental mechanisms of somatic CAG repeat instability are poorly understood, but locally formed secondary DNA structures generated during replication and/or repair are believed to underlie triplet repeat expansion. Recent studies in HD mice have demonstrated that mismatch repair (MMR) and base excision repair (BER) proteins are expansion inducing components in brain tissues. This study was designed to simultaneously investigate the rates and modes of expansion in different tissues of HD R6/1 mice in order to further understand the expansion mechanisms in vivo. We demonstrate continuous small expansions in most somatic tissues (exemplified by tail), which bear the signature of many short, probably single-repeat expansions and contractions occurring over time. In contrast, striatum and cortex display a dramatic--and apparently irreversible--periodic expansion. Expansion profiles displaying this kind of periodicity in the expansion process have not previously been reported. These in vivo findings imply that mechanistically distinct expansion processes occur in different tissues.
Conflict of interest statement
The authors have declared that no competing interests exist.
Figures


Similar articles
-
Transcription elongation and tissue-specific somatic CAG instability.PLoS Genet. 2012;8(11):e1003051. doi: 10.1371/journal.pgen.1003051. Epub 2012 Nov 29. PLoS Genet. 2012. PMID: 23209427 Free PMC article.
-
Genetic background modifies nuclear mutant huntingtin accumulation and HD CAG repeat instability in Huntington's disease knock-in mice.Hum Mol Genet. 2006 Jun 15;15(12):2015-24. doi: 10.1093/hmg/ddl125. Epub 2006 May 10. Hum Mol Genet. 2006. PMID: 16687439
-
Stoichiometry of base excision repair proteins correlates with increased somatic CAG instability in striatum over cerebellum in Huntington's disease transgenic mice.PLoS Genet. 2009 Dec;5(12):e1000749. doi: 10.1371/journal.pgen.1000749. Epub 2009 Dec 4. PLoS Genet. 2009. PMID: 19997493 Free PMC article.
-
Methods for Assessing DNA Repair and Repeat Expansion in Huntington's Disease.Methods Mol Biol. 2018;1780:483-495. doi: 10.1007/978-1-4939-7825-0_22. Methods Mol Biol. 2018. PMID: 29856032 Review.
-
Modifiers of Somatic Repeat Instability in Mouse Models of Friedreich Ataxia and the Fragile X-Related Disorders: Implications for the Mechanism of Somatic Expansion in Huntington's Disease.J Huntingtons Dis. 2021;10(1):149-163. doi: 10.3233/JHD-200423. J Huntingtons Dis. 2021. PMID: 33579860 Free PMC article. Review.
Cited by
-
CGG Repeat Expansion, and Elevated Fmr1 Transcription and Mitochondrial Copy Number in a New Fragile X PM Mouse Embryonic Stem Cell Model.Front Cell Dev Biol. 2020 Jun 30;8:482. doi: 10.3389/fcell.2020.00482. eCollection 2020. Front Cell Dev Biol. 2020. PMID: 32695777 Free PMC article.
-
Prospective natural history study of C9orf72 ALS clinical characteristics and biomarkers.Neurology. 2019 Oct 22;93(17):e1605-e1617. doi: 10.1212/WNL.0000000000008359. Epub 2019 Oct 2. Neurology. 2019. PMID: 31578300 Free PMC article.
-
Quantification of age-dependent somatic CAG repeat instability in Hdh CAG knock-in mice reveals different expansion dynamics in striatum and liver.PLoS One. 2011;6(8):e23647. doi: 10.1371/journal.pone.0023647. Epub 2011 Aug 29. PLoS One. 2011. PMID: 21897851 Free PMC article.
-
The role of break-induced replication in large-scale expansions of (CAG)n/(CTG)n repeats.Nat Struct Mol Biol. 2017 Jan;24(1):55-60. doi: 10.1038/nsmb.3334. Epub 2016 Dec 5. Nat Struct Mol Biol. 2017. PMID: 27918542 Free PMC article.
-
Trinucleotide repeats and haplotypes at the huntingtin locus in an Indian sample overlaps with European haplogroup a.PLoS Curr. 2014 Sep 24;6:ecurrents.hd.a3ad1a381ab1eed117675145318c9a80. doi: 10.1371/currents.hd.a3ad1a381ab1eed117675145318c9a80. PLoS Curr. 2014. PMID: 25642374 Free PMC article.
References
-
- The Huntington's Disease Collaborative Research Group. A novel gene containing a trinucleotide repeat that is expanded and unstable on Huntington's disease chromosomes. Cell. 1993;72:971–983. - PubMed
-
- Andrew SE, Goldberg YP, Kremer B, Telenius H, Theilmann J, et al. The relationship between trinucleotide (CAG) repeat length and clinical features of Huntington's disease. Nat Genet. 1993;4:398–403. - PubMed
-
- Duyao M, Ambrose C, Myers R, Novelletto A, Persichetti F, et al. Trinucleotide repeat length instability and age of onset in Huntington's disease. Nat Genet. 1993;4:387–392. - PubMed
-
- Ambrose C, Myers R, Novelletto A, Persichetti F, Frontali M, et al. Relationship between trinucleotide repeat expansion and phenotypic variation in Huntington's disease. Nat Genet. 1993;4:393–397. - PubMed
-
- Stine OC, Pleasant N, Franz ML, Abbott MH, Folstein SE, et al. Correlation between the onset age of Huntington's disease and length of the trinucleotide repeat in IT-15. Hum Mol Genet. 1993;2:1547–1549. - PubMed
Publication types
MeSH terms
Substances
LinkOut - more resources
Full Text Sources
Other Literature Sources
Medical
Molecular Biology Databases

