Network medicine: a network-based approach to human disease
- PMID: 21164525
- PMCID: PMC3140052
- DOI: 10.1038/nrg2918
Network medicine: a network-based approach to human disease
Abstract
Given the functional interdependencies between the molecular components in a human cell, a disease is rarely a consequence of an abnormality in a single gene, but reflects the perturbations of the complex intracellular and intercellular network that links tissue and organ systems. The emerging tools of network medicine offer a platform to explore systematically not only the molecular complexity of a particular disease, leading to the identification of disease modules and pathways, but also the molecular relationships among apparently distinct (patho)phenotypes. Advances in this direction are essential for identifying new disease genes, for uncovering the biological significance of disease-associated mutations identified by genome-wide association studies and full-genome sequencing, and for identifying drug targets and biomarkers for complex diseases.
Figures


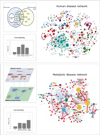
Interactome reconstruction, which merges the most up-to-date information on protein-protein interactions, co-complex memberships, regulatory interactions, and metabolic network maps (Box 1) in the tissue and cell line of interest. These networks are occasionally augmented with phenotypic links, such as coexpression-based relationships, but such phenotypic measures are best utilized later to test the functional homogeneity of the predicted disease module.
Disease gene (seed) identification, collects the known disease-associated genes obtained from linkage analysis, GWAS, or other sources, serving as the seed of the disease module.
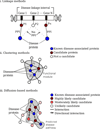
Disease module identification. The seed genes are placed on the interactome, aiming to identify a subnetwork that contains most of the disease-associated components, exploiting both the functional and topological modularity of the network. If such statistically significant agglomeration is detected, then one can use a combination of clustering tools– to identify the functionally and topologically compact subgraph that contains most disease components, representing the potential disease module. The closer the phenotypic manifestations are of the two diseases (organ, symptoms, drug response), the more significant is the expected overlap between the modules associated with two diseases.
Pathway identification: Occasionally, the number of components the ascertained disease module contains is so large that it cannot serve as a tractable starting point for further experimental work. In this case it may be necessary to identify the specific molecular pathways whose disruption may be responsible for the disease phenotype. One typically uses the network parsimony principle (Box 3) to select the most likely disease pathways, assuming that causal pathways are the shortest paths connecting the known disease components.
Validation/prediction: The disease modules are tested for their functional and dynamic homogeneity. The nature of the validation depends on the tools and data available to the investigator; gene expression data can validate the dynamical integrity of the disease module, and GWAS can be used to test the potential links between the SNPs of the predicted cellular components and the disease phenotype. Finally, the predicted disease genes and pathways (serving also as potential drug targets) are tested using the available molecular biology tools and animal models.


Comment in
-
Recommended reading from the hospital clinic (barcelona, Spain) pulmonary and critical care fellows: alvar agusti, program director.Am J Respir Crit Care Med. 2011 Aug 15;184(4):482-3. doi: 10.1164/rccm.201101-0153RR. Am J Respir Crit Care Med. 2011. PMID: 21844516 No abstract available.
-
LITERATURE Watch: implications for transplantation.Am J Transplant. 2013 Jan;13(1):3. doi: 10.1111/ajt.12072. Am J Transplant. 2013. PMID: 23279677 No abstract available.
Similar articles
-
Repositioning drugs by targeting network modules: a Parkinson's disease case study.BMC Bioinformatics. 2017 Dec 28;18(Suppl 14):532. doi: 10.1186/s12859-017-1889-0. BMC Bioinformatics. 2017. PMID: 29297292 Free PMC article.
-
A paradigm shift in medicine: A comprehensive review of network-based approaches.Biochim Biophys Acta Gene Regul Mech. 2020 Jun;1863(6):194416. doi: 10.1016/j.bbagrm.2019.194416. Epub 2019 Aug 2. Biochim Biophys Acta Gene Regul Mech. 2020. PMID: 31382052 Review.
-
Pathway networks generated from human disease phenome.BMC Med Genomics. 2018 Sep 14;11(Suppl 3):75. doi: 10.1186/s12920-018-0386-2. BMC Med Genomics. 2018. PMID: 30255817 Free PMC article.
-
Systematic analysis of genes and diseases using PheWAS-Associated networks.Comput Biol Med. 2019 Jun;109:311-321. doi: 10.1016/j.compbiomed.2019.04.037. Epub 2019 May 1. Comput Biol Med. 2019. PMID: 31128465
-
Molecular networks as sensors and drivers of common human diseases.Nature. 2009 Sep 10;461(7261):218-23. doi: 10.1038/nature08454. Nature. 2009. PMID: 19741703 Review.
Cited by
-
Prediction of Oral Cancer Biomarkers by Salivary Proteomics Data.Int J Mol Sci. 2024 Oct 16;25(20):11120. doi: 10.3390/ijms252011120. Int J Mol Sci. 2024. PMID: 39456901 Free PMC article.
-
Schizophrenia at a genetics crossroads: where to now?Schizophr Bull. 2013 May;39(3):490-5. doi: 10.1093/schbul/sbt041. Epub 2013 Mar 21. Schizophr Bull. 2013. PMID: 23519022 Free PMC article. No abstract available.
-
Genetic studies of quantitative MCI and AD phenotypes in ADNI: Progress, opportunities, and plans.Alzheimers Dement. 2015 Jul;11(7):792-814. doi: 10.1016/j.jalz.2015.05.009. Alzheimers Dement. 2015. PMID: 26194313 Free PMC article. Review.
-
Network-based gene prediction for Plasmodium falciparum malaria towards genetics-based drug discovery.BMC Genomics. 2015;16 Suppl 7(Suppl 7):S9. doi: 10.1186/1471-2164-16-S7-S9. Epub 2015 Jun 11. BMC Genomics. 2015. PMID: 26099491 Free PMC article.
-
Pharmacointeraction network models predict unknown drug-drug interactions.PLoS One. 2013 Apr 19;8(4):e61468. doi: 10.1371/journal.pone.0061468. Print 2013. PLoS One. 2013. PMID: 23620757 Free PMC article.
References
Publication types
MeSH terms
Grants and funding
- U54 HL070819/HL/NHLBI NIH HHS/United States
- P01 HL048743/HL/NHLBI NIH HHS/United States
- R01 HL061795/HL/NHLBI NIH HHS/United States
- HL81587/HL/NHLBI NIH HHS/United States
- HL70819/HL/NHLBI NIH HHS/United States
- U54 HL070819-07/HL/NHLBI NIH HHS/United States
- P01 HL048743-19/HL/NHLBI NIH HHS/United States
- R37 HL061795-13/HL/NHLBI NIH HHS/United States
- HL061795/HL/NHLBI NIH HHS/United States
- HL48743/HL/NHLBI NIH HHS/United States
- R37 HL061795/HL/NHLBI NIH HHS/United States
- R21 HL089734/HL/NHLBI NIH HHS/United States
- R21 HL089734-03/HL/NHLBI NIH HHS/United States
- P01 HL081587/HL/NHLBI NIH HHS/United States
LinkOut - more resources
Full Text Sources
Other Literature Sources

