. 2011 Mar;25(3):538-50.
doi: 10.1038/leu.2010.289. Epub 2010 Dec 17.

The novel JAK inhibitor AZD1480 blocks STAT3 and FGFR3 signaling, resulting in suppression of human myeloma cell growth and survival

Affiliations

The novel JAK inhibitor AZD1480 blocks STAT3 and FGFR3 signaling, resulting in suppression of human myeloma cell growth and survival

A Scuto et al. Leukemia. 2011 Mar.

Abstract

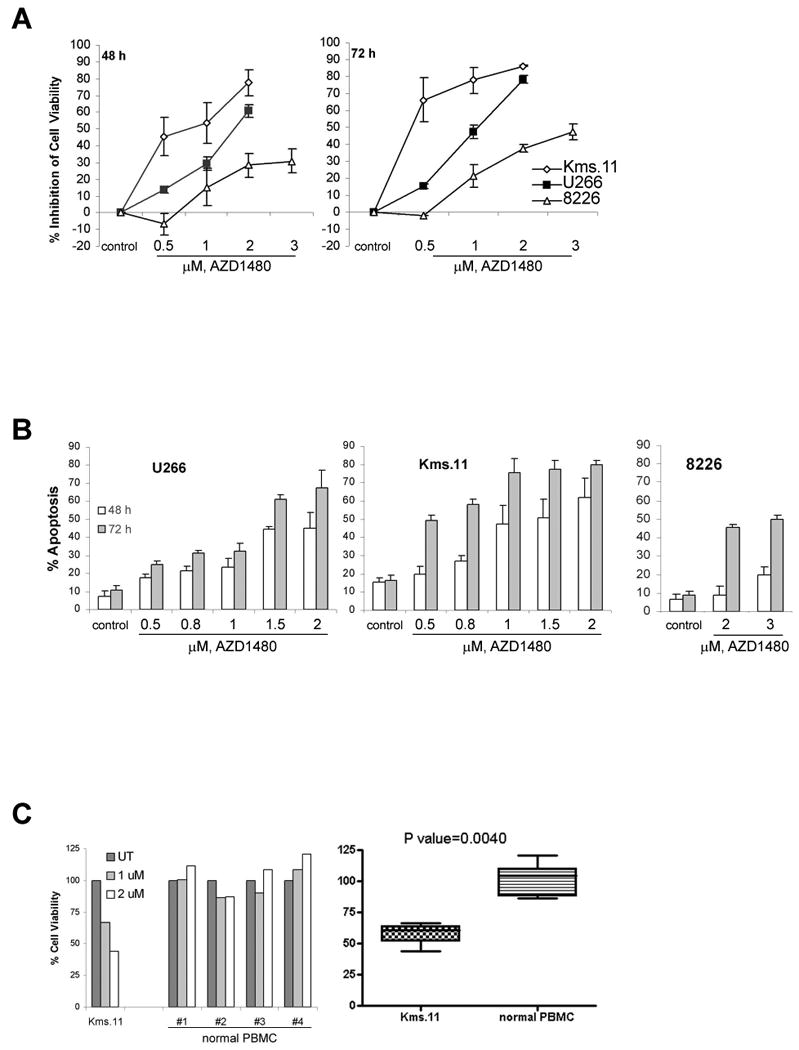
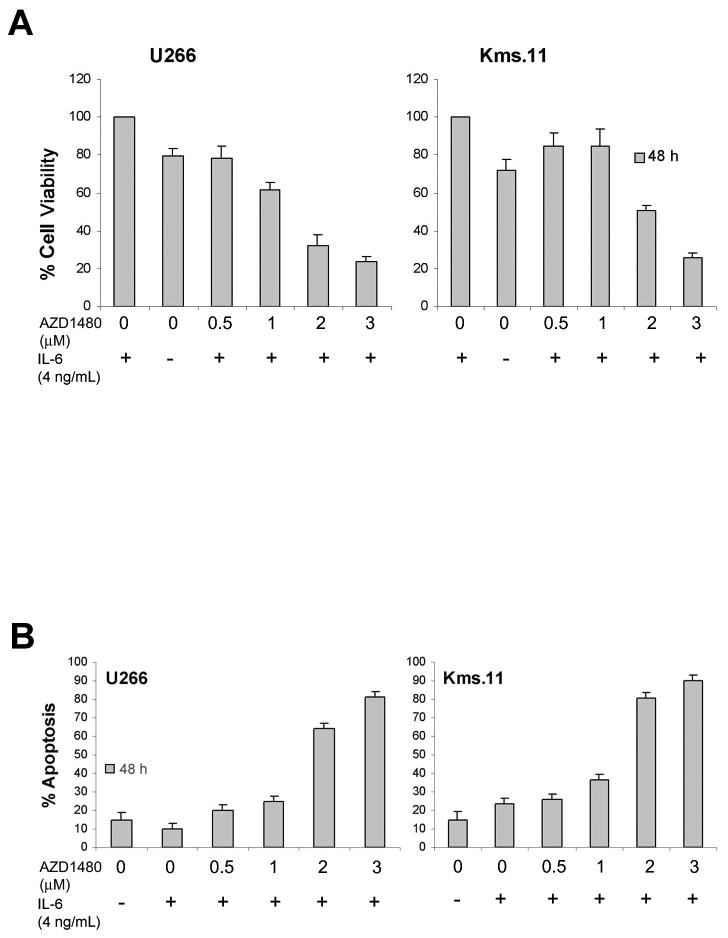
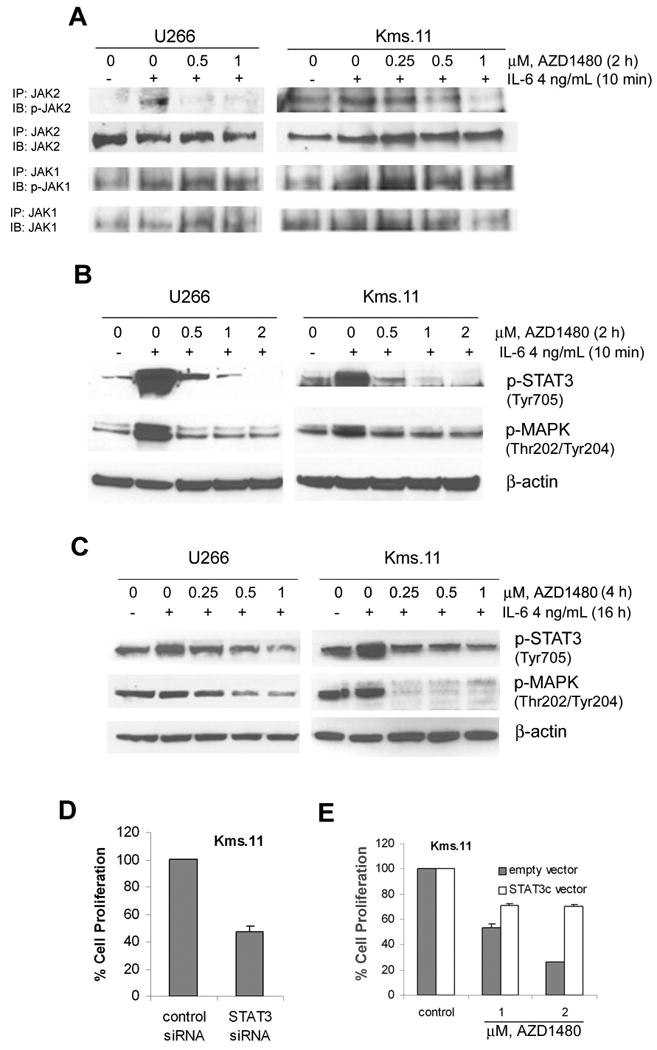
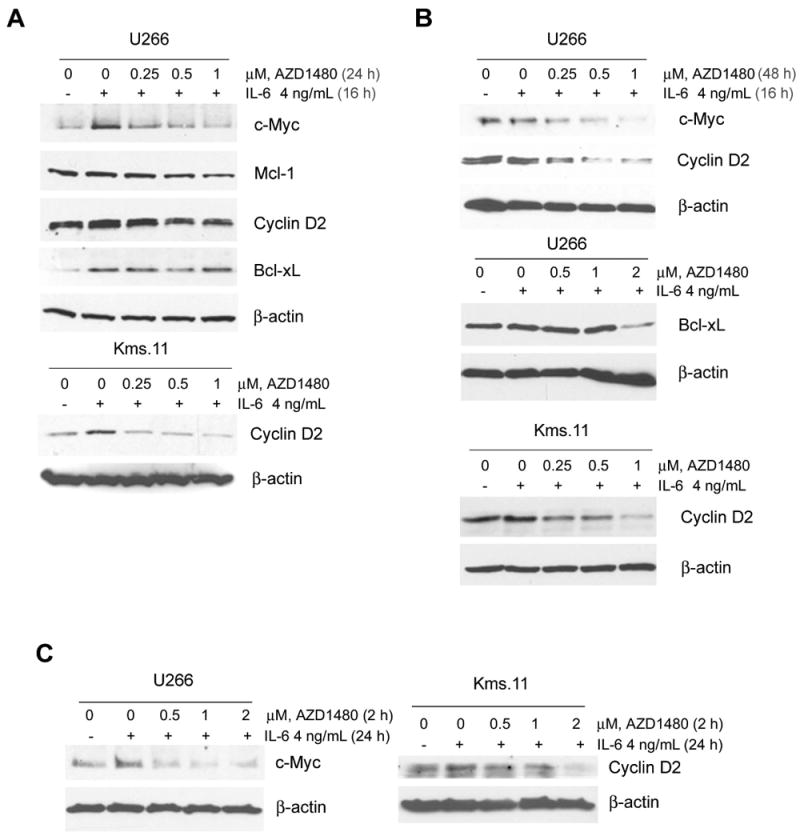
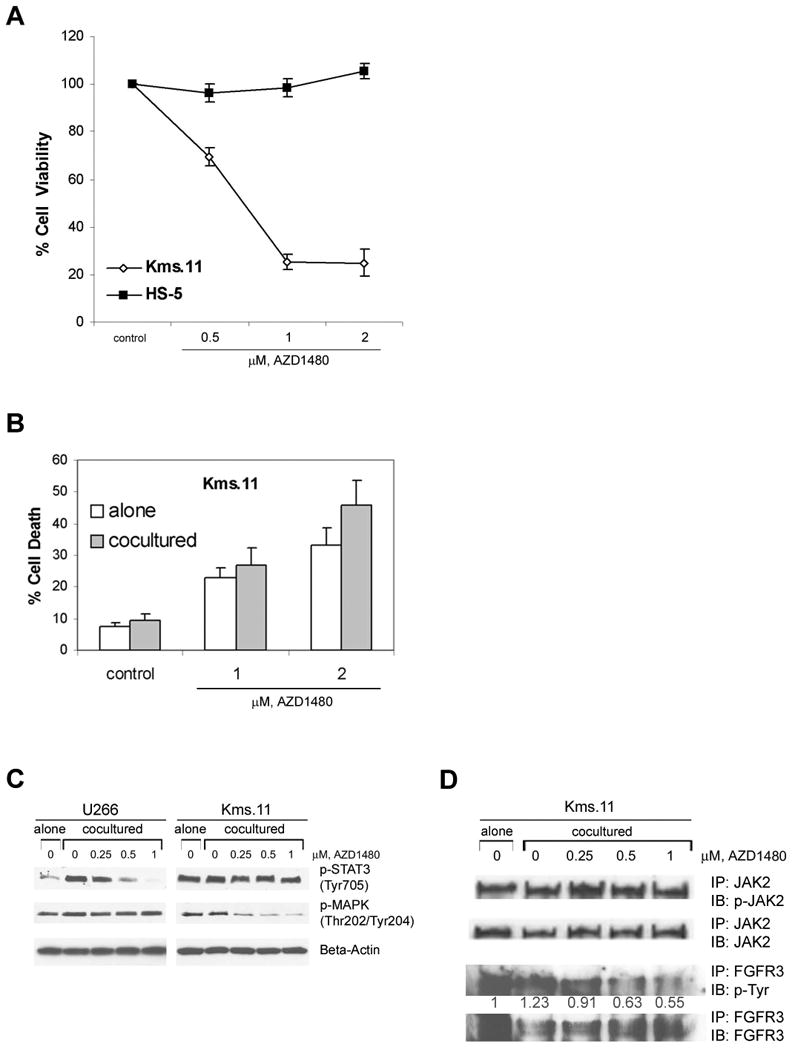
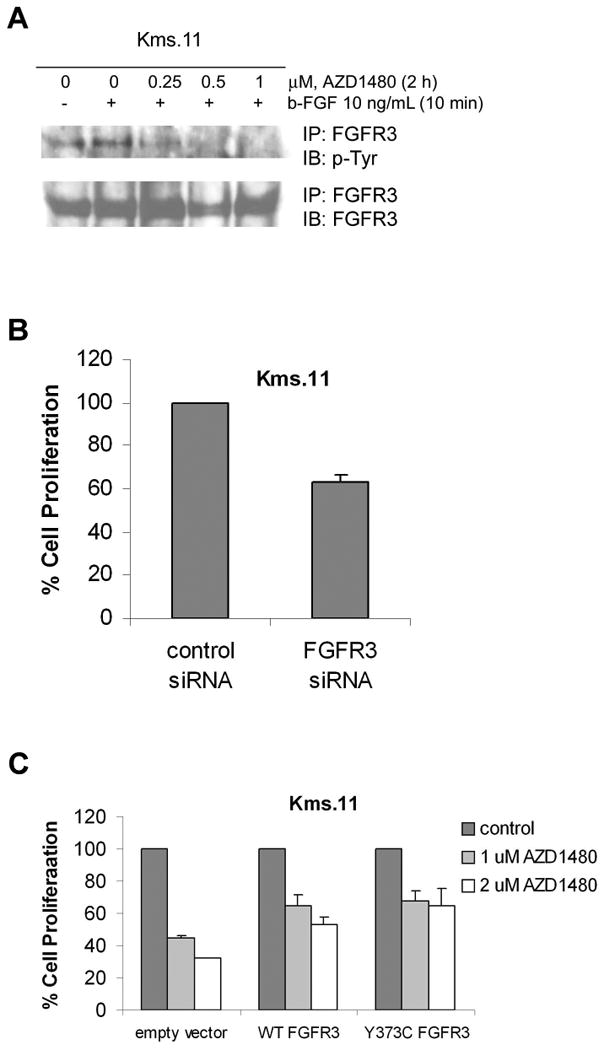
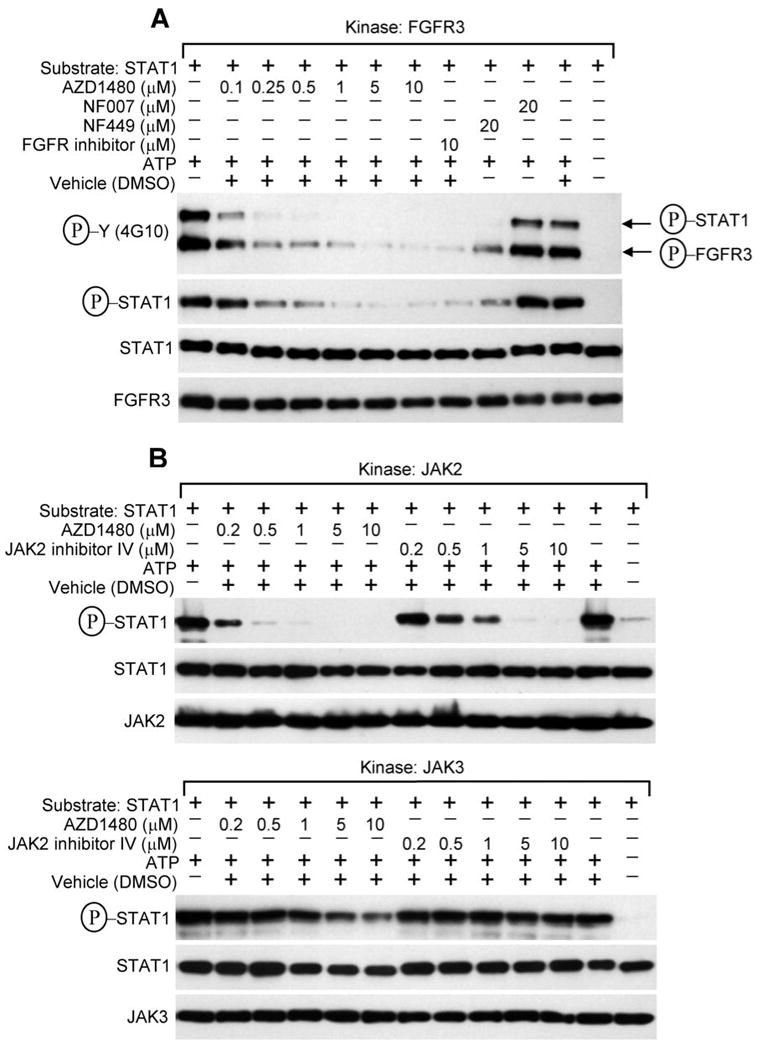
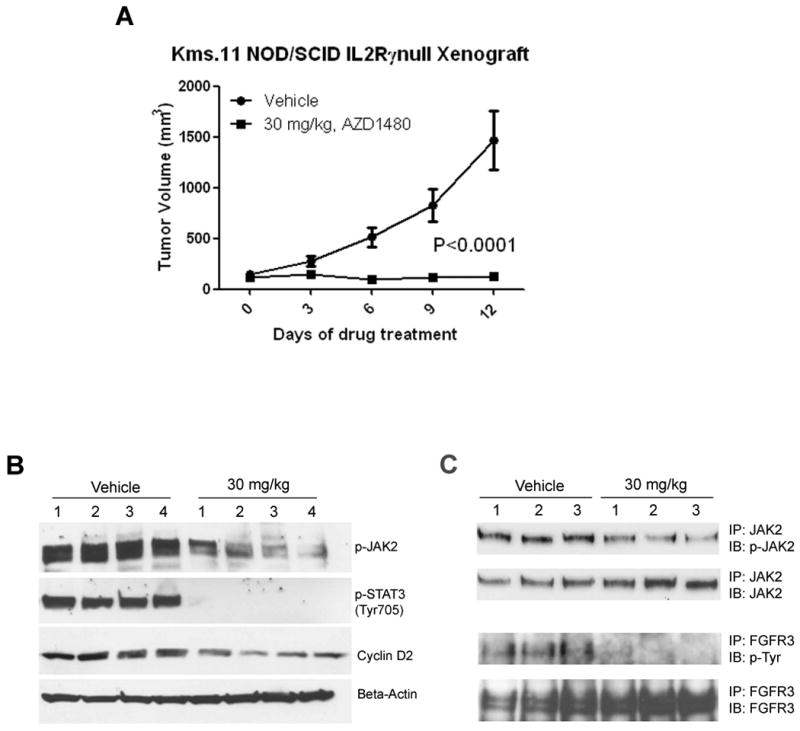
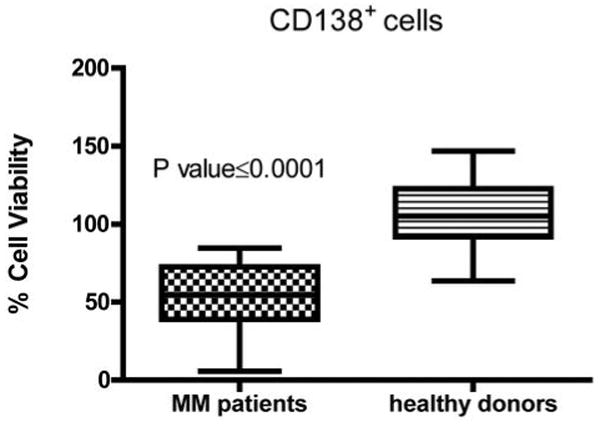
IL-6 and downstream JAK-dependent signaling pathways have critical roles in the pathophysiology of multiple myeloma (MM). We investigated the effects of a novel small-molecule JAK inhibitor (AZD1480) on IL-6/JAK signal transduction and its biological consequences on the human myeloma-derived cell lines U266 and Kms.11. At low micromolar concentrations, AZD1480 blocks cell proliferation and induces apoptosis of myeloma cell lines. These biological responses to AZD1480 are associated with concomitant inhibition of phosphorylation of JAK2, STAT3 and MAPK signaling proteins. In addition, there is inhibition of expression of STAT3 target genes, particularly Cyclin D2. Examination of a wider variety of myeloma cells (RPMI 8226, OPM-2, NCI-H929, Kms.18, MM1.S and IM-9), as well as primary myeloma cells, showed that AZD1480 has broad efficacy. In contrast, viability of normal peripheral blood (PB) mononuclear cells and CD138(+) cells derived from healthy controls was not significantly inhibited. Importantly, AZD1480 induces cell death of Kms.11 cells grown in the presence of HS-5 bone marrow (BM)-derived stromal cells and inhibits tumor growth in a Kms.11 xenograft mouse model, accompanied with inhibition of phospho-FGFR3, phospho-JAK2, phospho-STAT3 and Cyclin D2 levels. In sum, AZD1480 blocks proliferation, survival, FGFR3 and JAK/STAT3 signaling in myeloma cells cultured alone or cocultured with BM stromal cells, and in vivo. Thus, AZD1480 represents a potential new therapeutic agent for patients with MM.


Conflict of interest statement

Conflict of interest: This work was partially supported by AstraZeneca whose product, AZD1480, was studied in the present work.

Figures

Figure 1
Figure 1. AZD1480 induces apoptosis of myeloma cells but does not affect the viability of normal peripheral blood mononuclear cells
(A) Cells were treated with the indicated concentrations of AZD1480 for 48 or 72 h. Following this, the percentage of cell viability inhibition was determined by MTS assay. Values represented as graphs are the mean of 3 independent experiments with standard deviation. (B) Cells were treated with the indicated concentrations of AZD1480 for 48 or 72 h. Following this, the percentage of apoptotic cells was determined by flow cytometry using Annexin V/Propidium Iodide staining. Values represented as bar graphs are the mean of 3 independent experiments with the standard deviation. (C) Samples of primary PBMCs cells from healthy donors were treated in culture with the indicated concentrations of AZD1480 for 48 h. The percentage of viable cells was determined by DIMSCAN analysis. Values represent the percentages of cell viability normalized to that of the untreated cells and are the mean of three separate treatments.
Figure 2
Figure 2. AZD1480 induces apoptosis of myeloma cells growth stimulated by IL-6
(A) Cells were grown in the presence of IL-6 for 16 h followed by treatment with the indicated concentrations of AZD1480 for 48 h. Following this, the percentage of cell viability inhibition was determined by MTS assay. Values represented as bar graphs are the mean of 3 independent experiments with the standard deviation. (B) Cells were grown in the presence of IL-6 for 16 h followed by treatment with the indicated concentrations of AZD1480 for 48 h. Following this, the percentage of apoptotic cells was determined by flow cytometry using Annexin V/Propidium Iodide staining. Values represented as bar graphs are the mean of 3 independent experiments with the standard deviation.
Figure 3
Figure 3. AZD1480 inhibits IL-6-inducible activation of JAK2 and phosphorylation of STAT3 and MAPK in myeloma cells
(A) Cells were incubated overnight in medium containing charcoal-stripped serum and then treated with the indicated concentrations of AZD1480 for 2 h followed by stimulation with IL-6 for 10 min. After this, immunoprecipitation with JAK1 or JAK2 antibody followed by Western blot analysis of phospho-JAK1 or phospho-JAK2 was performed on the cell lysates from U266 or Kms.11. The levels of total JAK1 or JAK2 protein served as loading controls. Results are representative of three independent experiments. (B) Cells were incubated overnight in medium containing charcoal-stripped serum and then treated with the indicated concentrations of AZD1480 for 2 h, followed by stimulation with IL-6 for 10 min. Subsequently, Western blot analysis of p-STAT3 and p-MAPK was performed on the cell lysates from U266 and Kms.11. The levels of β-actin protein served as loading controls. Results are representative of three independent experiments. (C) Cells were grown in the presence of IL-6 for 16 h followed by treatment with indicated concentrations of AZD1480 for 4 h. After this, Western blot analysis of p-STAT3 and p-MAPK was performed on the cell lysates from U266 and Kms.11. The levels of β-actin protein served as loading controls. Results are representative of three independent experiments. (D) Kms.11 cells were transfected with Cy3-labeled STAT3 siRNA or negative control siRNA and 24 h later Cy3-positive cells were sorted. The percentage of cell proliferation was determined 72 h post transfection by MTS assay. Values represented as bar graphs are the means of 3 independent experiments plus the standard deviation. (E) Cells were stable transfected with a vector expressing STAT3c or empty vector. Stable transfected cells were treated with AZD1480. After 48 h of treatment, the percentage of cell proliferation was determined by MTS assay. Both empty vector and STAT3c vector values are normalized to 100%. Values represented as bar graphs are the means of 3 independent experiments plus the standard deviation.
Figure 4
Figure 4. AZD1480 inhibits the IL-6-inducible upregulation of the STAT3 target genes c-Myc and Cyclin-D2
Cells were treated with the indicated concentrations of AZD1480 for 24 h (A) or 48 h (B) after a preincubation with IL-6 for 16 h. Subsequently, Western blot analysis of c-Myc, Mcl-1, Cyclin-D2 and Bcl-xL proteins was performed on the lysates from U266 and Kms.11 cells. The levels of β-actin protein served as loading controls. Results are representative of three independent experiments. (C) Cells were treated with the indicated concentrations of AZD1480 for 2 h followed by incubation with IL-6 for 24 h. Subsequently, Western blot analysis of c-Myc and Cyclin-D2 proteins was performed on the lysates from U266 and Kms.11 cells. The levels of β-actin protein served as loading controls. Results are representative of three independent experiments.
Figure 5
Figure 5. Coculture of myeloma cells with bone marrow stroma-derived cells does not confer resistance to AZD1480
(A) HS-5 or Kms.11 cells were treated with the indicated concentrations of AZD1480 for 48 h. Following this, the percentage of cell viability inhibition was determined by MTS assay. Values represented as graphs are the mean of 3 independent experiments with the standard deviation. (B) CFSE-labeled Kms.11 cells were plated on an established bone marrow stromal layer. After 24 h of coculture, cells were treated with AZD1480 for 48 h. Subsequentially, cells were separated from the stromal layer, stained with DAPI and analyzed by flow cytometry. The percentage of cell death was calculated based on all DAPI-positive cells after gating on CFSE-positive Kms.11 cells. Values represented as bar graphs are the mean of 3 independent experiments with the standard deviation. (C) Tumor cells were kept overnight in medium containing charcoal-stripped serum and then plated on an established bone marrow stromal layer. After 48 h of coculture, cells were incubated with AZD1480 for 2 h. Tumor cells were then separated from the stromal layer and Western blot analysis of p-STAT3 and p-MAPK was performed on the cell lysates. The levels of β-actin protein served as loading controls. Results are representative of three independent experiments. (D) Tumor cells were kept overnight in medium containing charcoal-stripped serum and then plated on an established bone marrow stromal layer. After 48 h of coculture, cells were incubated with AZD1480 for 2 h. Tumor cells were then separated from the stromal layer and immunoprecipitation with JAK2 or FGFR3 antibody followed by Western blot analysis of phospho-JAK2 or phospho-Tyr was performed on the cell lysates from Kms.11 cells. The levels of total JAK2 or FGFR3 protein served as loading controls. The values shown below p-Tyr immunoblot represent the relative expression of p-FGFR3, calculated using the IDV values normalized to those of FGFR3. Results are representative of three independent experiments.
Figure 6
Figure 6. AZD1480 inhibits b-FGF-inducible activation of FGFR3 in Kms.11 cells
(A) Cells were incubated overnight in medium containing charcoal-stripped serum and then treated with the indicated concentrations of AZD1480 for 2 h followed by stimulation with b-FGF for 10 min. After this, immunoprecipitation with FGFR3 antibody followed by Western blot analysis of phospho-Tyr was performed on the cell lysates from Kms.11 cells. The levels of total FGFR3 protein served as loading controls. Results are representative of three independent experiments. (B) Kms.11 cells were transfected with Cy3-labeled FGFR3 siRNA or negative control siRNA and 24 h later Cy3-positive cells were sorted. The percentage of cell proliferation was determined 72 h post transfection by MTS assay. Values represented as bar graphs are the means of 3 independent experiments plus the standard deviation. (C) Cells were transiently transfected with vectors expressing wild-type (WT) or Y373C-FGFR3 constructs or empty vector. Transfected cells were treated with AZD1480. After 48 h of treatment, the percentage of cell proliferation was determined by MTS assay. Empty vector and FGFR3 vectors values are normalized to 100%. Values represented as bar graphs are the means of 3 independent experiments plus the standard deviation.
Figure 7
Figure 7. AZD1480 inhibits both JAK2 and FGFR3 activity in a cell-free kinase assay
(A-B) Cell-free kinase assays were carried-out as described in the Experimental procedures, with the recombinant FGFR3, JAK2 and JAK3 as kinases, recombinant STAT1 as a substrate, and inhibitors added directly to the kinase reactions. Kinase-mediated phosphorylation of STAT1 was detected by Western blotting with P-STAT1 (Y701) antibody or 4G10 P-Y antibody. The membranes probed for FGFR3, JAK2, JAK3 and STAT1 serve as controls for kinase and substrate quantity, respectively. Sample with ATP omitted serves as a negative control for the kinase reaction. (A) Note that both FGFR3 autophosphorylation and FGFR3-mediated phosphorylation of STAT1 are inhibited by low concentrations of AZD1480, as compared to FGFR inhibitor or NF449. NF007 serves as negative control for FGFR3 inhibition (53). (B) Note the potent inhibitory activity of AZD1480 against JAK2, as compared to JAK inhibitor (upper panel). Also note the poor inhibitory activity of AZD1480 against JAK3 (lower panel).
Figure 8
Figure 8. AZD1480 reduces the tumor growth of Kms.11 xenograft in mice associated with inhibition of JAK2/STAT3 and FGFR3 signaling and Cyclin D2 in vivo
(A) Kms.11 tumor-bearing mice were treated with vehicle or AZD1480 at 30 mg/kg twice a day for two weeks. (B) A separate cohort of mice was treated once a day with vehicle or 30 mg/kg AZD1480. When the tumor size of vehicle group and drug group reached an average volume of 1467 and 162 mm3, respectively, four tumor samples from each group were harvested 2 h post dosing; the weight average was 1.52 and 0.24 g in the vehicle and drug group mice, respectively. Whole-cell lysates were prepared and subjected to Western blot analysis or immunoprecipitation followed by immunoblot (C). Equal amounts of protein were analyzed.
Figure 9
Figure 9. AZD1480 does not affect the viability of normal CD138+ cells
Primary CD138+ cells isolated from the peripheral blood of 5 healthy donors and from the bone marrow of 4 MM patients were treated in culture with the indicated concentrations of AZD1480 for 48 h. The percentage of viable cells was determined by DIMSCAN analysis. Values represent the percentages of cell viability normalized to that of the untreated cells. Values from two separate treatments were used to generate the graph.

Similar articles

Cited by

References

    1. Kyle RA, Rajkumar SV. Multiple myeloma. Blood. 2008 Mar 15;111(6):2962–2972. - PMC - PubMed
    1. Fonseca R, Stewart AK. Targeted therapeutics for multiple myeloma: the arrival of a risk-stratified approach. Mol Cancer Ther. 2007 Mar;6(3):802–810. - PubMed
    1. San-Miguel J, Harousseau JL, Joshua D, Anderson KC. Individualizing treatment of patients with myeloma in the era of novel agents. J Clin Oncol. 2008 Jun 1;26(16):2761–2766. - PubMed
    1. Ocio EM, Mateos MV, Maiso P, Pandiella A, San-Miguel JF. New drugs in multiple myeloma: mechanisms of action and phase I/II clinical findings. Lancet Oncol. 2008 Dec;9(12):1157–1165. - PubMed
    1. Vallet S, Palumbo A, Raje N, Boccadoro M, Anderson KC. Thalidomide and lenalidomide: Mechanism-based potential drug combinations. Leuk Lymphoma. 2008 Jul;49(7):1238–1245. - PubMed

Publication types

MeSH terms