

CRTC3 links catecholamine signalling to energy balance
- PMID: 21164481
- PMCID: PMC3025711
- DOI: 10.1038/nature09564
CRTC3 links catecholamine signalling to energy balance
Abstract
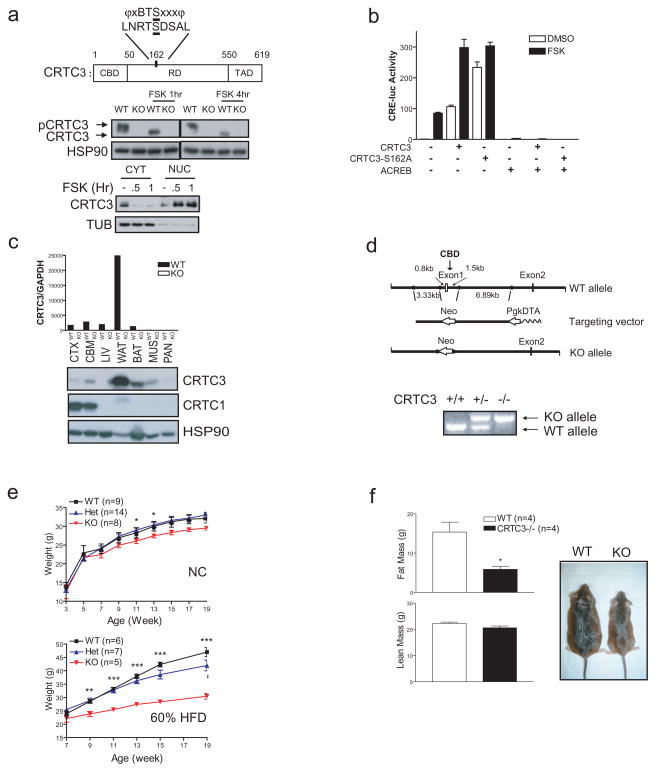
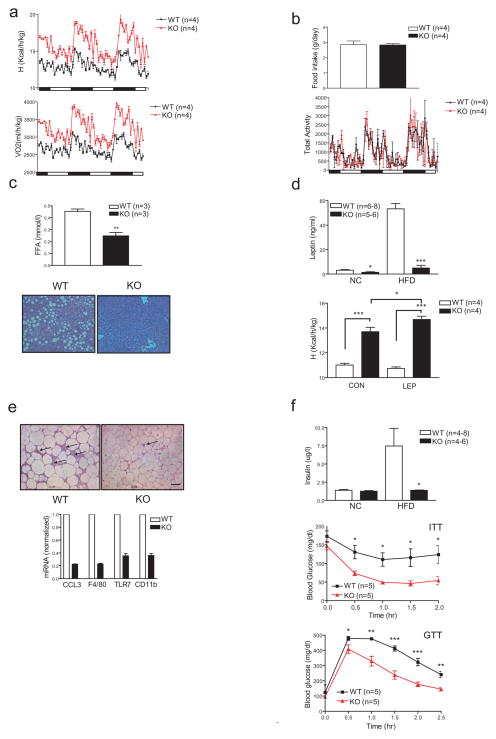
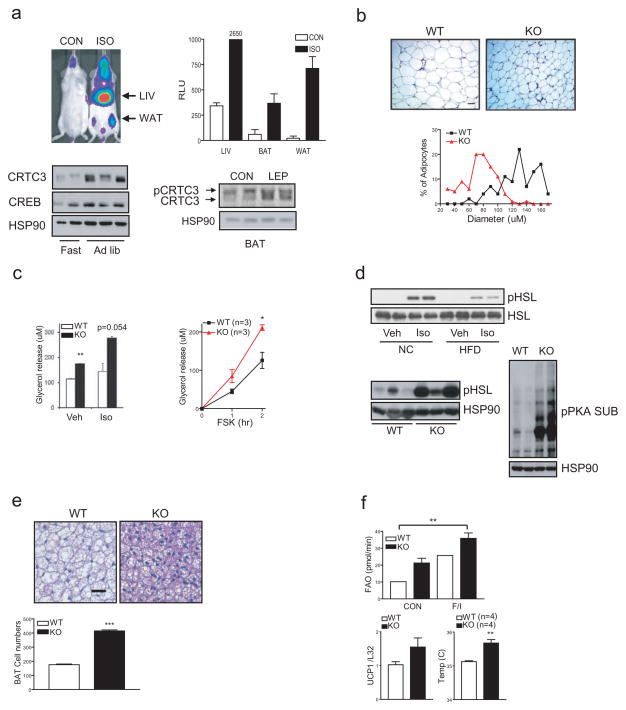
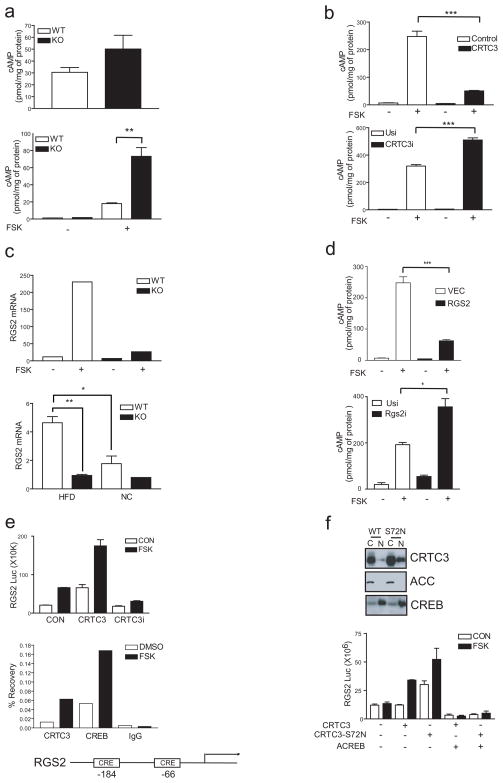
The adipose-derived hormone leptin maintains energy balance in part through central nervous system-mediated increases in sympathetic outflow that enhance fat burning. Triggering of β-adrenergic receptors in adipocytes stimulates energy expenditure by cyclic AMP (cAMP)-dependent increases in lipolysis and fatty-acid oxidation. Although the mechanism is unclear, catecholamine signalling is thought to be disrupted in obesity, leading to the development of insulin resistance. Here we show that the cAMP response element binding (CREB) coactivator Crtc3 promotes obesity by attenuating β-adrenergic receptor signalling in adipose tissue. Crtc3 was activated in response to catecholamine signals, when it reduced adenyl cyclase activity by upregulating the expression of Rgs2, a GTPase-activating protein that also inhibits adenyl cyclase activity. As a common human CRTC3 variant with increased transcriptional activity is associated with adiposity in two distinct Mexican-American cohorts, these results suggest that adipocyte CRTC3 may play a role in the development of obesity in humans.
Figures
Similar articles
-
cAMP-inducible coactivator CRTC3 attenuates brown adipose tissue thermogenesis.Proc Natl Acad Sci U S A. 2018 Jun 5;115(23):E5289-E5297. doi: 10.1073/pnas.1805257115. Epub 2018 May 21. Proc Natl Acad Sci U S A. 2018. PMID: 29784793 Free PMC article.
-
Regulation role of CRTC3 in skeletal muscle and adipose tissue.J Cell Physiol. 2018 Feb;233(2):818-821. doi: 10.1002/jcp.25917. Epub 2017 May 19. J Cell Physiol. 2018. PMID: 28322447 Review.
-
NEDD4L limits cAMP signaling through ubiquitination of CREB-regulated transcription coactivator 3.FASEB J. 2018 Jul;32(7):4053-4062. doi: 10.1096/fj.201701406R. Epub 2018 Mar 5. FASEB J. 2018. PMID: 29505301
-
Inflammation produces catecholamine resistance in obesity via activation of PDE3B by the protein kinases IKKε and TBK1.Elife. 2013 Dec 24;2:e01119. doi: 10.7554/eLife.01119. Elife. 2013. PMID: 24368730 Free PMC article.
-
The adipocyte supersystem of insulin and cAMP signaling.Trends Cell Biol. 2023 Apr;33(4):340-354. doi: 10.1016/j.tcb.2022.07.009. Epub 2022 Aug 18. Trends Cell Biol. 2023. PMID: 35989245 Free PMC article. Review.
Cited by
-
Knock-in Luciferase Reporter Mice for In Vivo Monitoring of CREB Activity.PLoS One. 2016 Jun 23;11(6):e0158274. doi: 10.1371/journal.pone.0158274. eCollection 2016. PLoS One. 2016. PMID: 27336479 Free PMC article.
-
JNK3 perpetuates metabolic stress induced by Aβ peptides.Neuron. 2012 Sep 6;75(5):824-37. doi: 10.1016/j.neuron.2012.06.024. Neuron. 2012. PMID: 22958823 Free PMC article.
-
Anabolic and Pro-metabolic Functions of CREB-CRTC in Skeletal Muscle: Advantages and Obstacles for Type 2 Diabetes and Cancer Cachexia.Front Endocrinol (Lausanne). 2019 Aug 2;10:535. doi: 10.3389/fendo.2019.00535. eCollection 2019. Front Endocrinol (Lausanne). 2019. PMID: 31428057 Free PMC article. Review.
-
Evidence for a neuromuscular circuit involving hypothalamic interleukin-6 in the control of skeletal muscle metabolism.Sci Adv. 2022 Jul 29;8(30):eabm7355. doi: 10.1126/sciadv.abm7355. Epub 2022 Jul 29. Sci Adv. 2022. PMID: 35905178 Free PMC article.
-
The distribution of messenger RNAs encoding the three isoforms of the transducer of regulated cAMP responsive element binding protein activity in the rat forebrain.J Neuroendocrinol. 2011 Aug;23(8):754-66. doi: 10.1111/j.1365-2826.2011.02178.x. J Neuroendocrinol. 2011. PMID: 21679259 Free PMC article.
References
-
- Bartness TJ, Song CK. Thematic review series: adipocyte biology. Sympathetic and sensory innervation of white adipose tissue. J Lipid Res. 2007;48:1655–72. - PubMed
-
- Lafontan M, Langin D. Lipolysis and lipid mobilization in human adipose tissue. Prog Lipid Res. 2009;48:275–97. - PubMed
-
- Bachman ES, et al. betaAR signaling required for diet-induced thermogenesis and obesity resistance. Science. 2002;297:843–5. - PubMed
-
- van Baak MA. The peripheral sympathetic nervous system in human obesity. Obes Rev. 2001;2:3–14. - PubMed
-
- Denzer C, et al. Gender-specific prevalences of fatty liver in obese children and adolescents: roles of body fat distribution, sex steroids, and insulin resistance. J Clin Endocrinol Metab. 2009;94:3872–81. - PubMed
Publication types
MeSH terms
Substances
Grants and funding
- R01 DK079888-05/DK/NIDDK NIH HHS/United States
- R01-L071205/PHS HHS/United States
- R01-DK049777/DK/NIDDK NIH HHS/United States
- N02 HL64278/HL/NHLBI NIH HHS/United States
- R01 HL088457/HL/NHLBI NIH HHS/United States
- M01 RR000425-36/RR/NCRR NIH HHS/United States
- N02HL64278/HL/NHLBI NIH HHS/United States
- R01 DK033651/DK/NIDDK NIH HHS/United States
- R01-HL088457/HL/NHLBI NIH HHS/United States
- N01HC95159/HL/NHLBI NIH HHS/United States
- R01 DK049777/DK/NIDDK NIH HHS/United States
- M01 RR000425/RR/NCRR NIH HHS/United States
- R01 HL071205/HL/NHLBI NIH HHS/United States
- R37 DK083834-27/DK/NIDDK NIH HHS/United States
- R01 DK079888/DK/NIDDK NIH HHS/United States
- M01-RR00425/RR/NCRR NIH HHS/United States
- R01 HL088457-04/HL/NHLBI NIH HHS/United States
- R37 DK083834-26/DK/NIDDK NIH HHS/United States
- N02-HL64278/HL/NHLBI NIH HHS/United States
- P30 DK063491-09/DK/NIDDK NIH HHS/United States
- R01-DK79888/DK/NIDDK NIH HHS/United States
- R37 DK083834/DK/NIDDK NIH HHS/United States
- R01 HL071205-05/HL/NHLBI NIH HHS/United States
- N01-HC95159/HC/NHLBI NIH HHS/United States
- P30 DK063491/DK/NIDDK NIH HHS/United States
- R01 DK083834/DK/NIDDK NIH HHS/United States
- R01-DK083834/DK/NIDDK NIH HHS/United States
- P30-DK063491/DK/NIDDK NIH HHS/United States
- N01 HC095159/HC/NHLBI NIH HHS/United States
- R01 DK049777-18/DK/NIDDK NIH HHS/United States
LinkOut - more resources
Full Text Sources
Other Literature Sources
Molecular Biology Databases
Research Materials
