. 2010 Dec 15;24(24):2748-53.
doi: 10.1101/gad.1995910.

Drosophila miR-14 regulates insulin production and metabolism through its target, sugarbabe

Affiliations

Drosophila miR-14 regulates insulin production and metabolism through its target, sugarbabe

Jishy Varghese et al. Genes Dev. .

Abstract

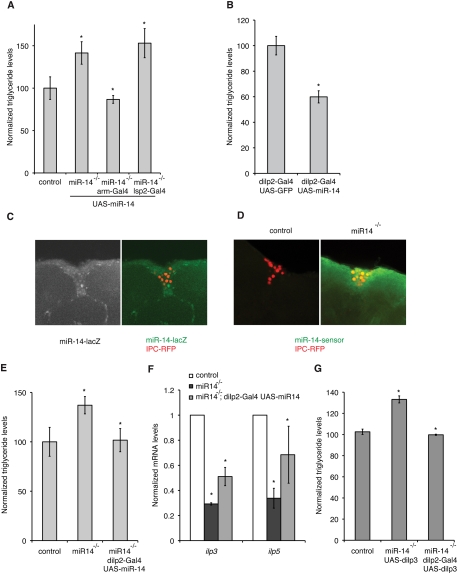
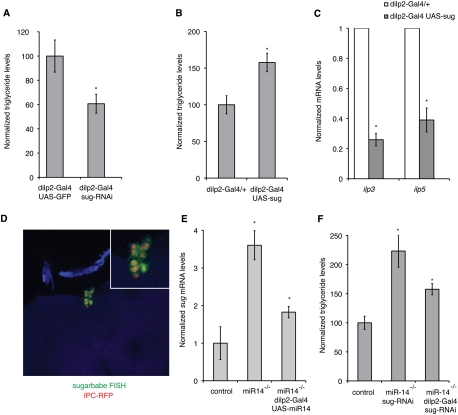
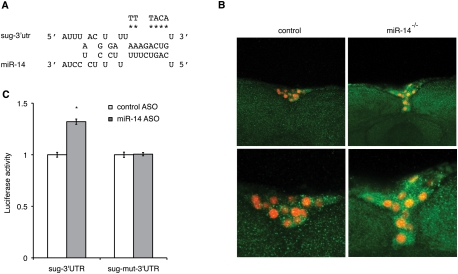
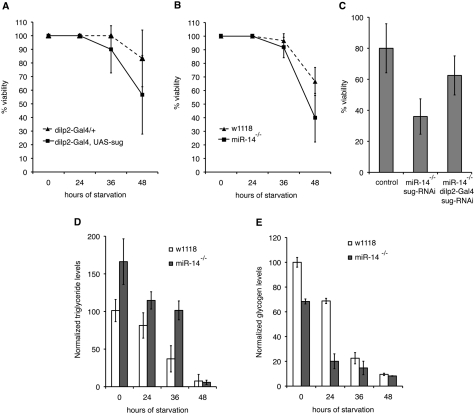
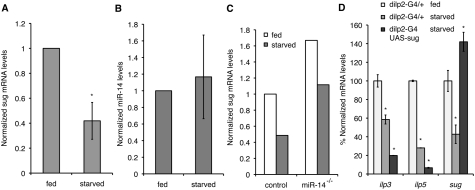
Energy homeostasis depends on insulin signaling in metazoans. Insulin levels reflect the nutritional status of the animal to control levels of circulating sugar and regulate storage of resources in the form of glycogen and fat. Over the past several years, evidence has begun to accumulate that insulin production and secretion, as well as cellular responsiveness to insulin, are subject to regulation by microRNAs. Here we present evidence that miR-14 acts in the insulin-producing neurosecretory cells in the adult Drosophila brain to control metabolism. miR-14 acts in these cells through its direct target, sugarbabe. sugarbabe encodes a predicted zinc finger protein that regulates insulin gene expression in the neurosecretory cells. Regulation of sugarbabe levels by nutrients and by miR-14 combines to allow the fly to manage resource mobilization in a nutritionally variable environment.


Figures

Figure 1.
Figure 1.
miR-14 acts in the insulin-producing neurosecretory cells to control insulin production. (A,B,E,G) Histograms showing the ratio of total body triglyceride to total body protein (genotypes as indicated). Data are mean ± standard deviation (SD) based on three independent biological replicates. P-values were determined using Student's t-test. (A) Genetic rescue of miR-14 mutants by expression of a UAS-miR-14 transgene. P = 0.02 comparing control and miR-14 mutant; P = 0.01 comparing miR-14 mutant and miR-14 mutant, arm-Gal4-UAS-miR-14; P = 0.41 comparing miR-14 mutant and miR-14 mutant, lsp2-Gal4-UAS-miR-14. (B) Overexpression of miR-14 in the IPCs using dILP2-Gal4. P = 0.03 comparing dilp2-Gal4 UAS-GFP and dilp2-Gal4 UAS-miR-14. (C) miR-14 lacZ expression in the adult brain visualized using anti-β−Gal (green). IPCs labeled by dILP2-Gal4-directed expression of UAS-nuclear RFP (red). (D) miR-14 sensor GFP in control and miR-14 mutant adult brain (green). IPCs labeled by dILP2-Gal4 UAS-nRFP (red). (E) Rescue of the miR-14 mutant by IPC-specific expression of miR-14 using dILP2-Gal4. P = 0.007 comparing miR14 mutant with miR14 mutant, dilp2-Gal4 UAS-miR-14. (F) Insulin-like peptide mRNA levels measured by quantitative RT–PCR (qRT–PCR). Data represent three independent experiments, normalized to RP49 mRNA and then to the level in control flies. For ilp3, P = 2.4E-09 comparing control with miR-14 mutant; P = 0.001 comparing miR14 mutant with miR14 mutant, dilp2-Gal4 UAS-miR-14. For ilp5, P = 1.7E-05 comparing control with miR-14 mutant; P = 0.01 comparing miR14 mutant with miR-14 mutant, dilp2-Gal4 UAS-miR-14. (G) Rescue of the miR-14 mutant by IPC-specific expression of UAS-dilp3 using dILP2-Gal4. P-value = 0.0001 comparing control and miR-14 mutant, UAS-ilp3 (without the Gal4 driver, middle); P-value = 3.3E-05 comparing miR-14 mutant UAS-ilp3 with miR-14 mutant, dilp2-Gal4 UAS-ilp3 (with the Gal4 driver).
Figure 2.
Figure 2.
Genetic evidence that miR-14 acts via sugarbabe. (A,B,F) Ratio of total body triglyceride to total body protein. (C,E) mRNA levels measured in flies of the indicated genotypes. Data are presented as mean ± SD based on three independent biological replicates. P-values determined using Student's t-test. (A) Depletion of sugarbabe by expression of a UAS-RNAi transgene in IPCs reduced fat levels. P = 0.006 comparing dilp2-Gal4 UAS-GFP with dilp2-Gal4 UAS-sug-RNAi. (B) Overexpression of sugarbabe in IPCs increased fat levels. P = 0.002 comparing dilp2-Gal4/+ with dilp2-Gal4 UAS-sug. (C) Overexpression of sugarbabe reduced expression of ilp mRNAs. P = 1.2E-08 for ilp3 mRNA; P = 2.8E-05 for ilp5 mRNA. (D) sugarbabe expression in the adult IPCs using FISH (green). IPCs marked by dILP2-Gal4 nRFP (red). (E) sugarbabe mRNA levels from expression-profiling data. P = 0.0013 comparing control with miR-14 mutant; P = 0.0052 comparing miR-14 mutant with rescue-miR-14 mutant, dilp2-Gal4 UAS-miR-14. (F) Partial suppression of miR-14 mutant phenotype by IPC-specific depletion of sugarbabe. P = 1.96E-05 comparing control with miR-14 mutant, UAS-sug-RNAi (without the Gal4 driver, middle); P = 0.001 comparing miR-14 mutant, UAS-sug-RNAi with miR-14 mutant, dilp2-Gal4 UAS-sug-RNAi (with the Gal4 driver).
Figure 3.
Figure 3.
miR-14 regulates sugarbabe expression. (A) Predicted miR-14 target site in the sugarbabe 3′UTR. Asterisks indicate residues changed in the target site mutant. (B) sugarbabe 3′UTR reporter transgene showing GFP expression in control and miR-14 mutant brains (green). IPCs marked by dILP2-Gal4 nRFP (red). (C) Luciferase assays showing regulation of a sugarbabe 3′UTR reporter. S2 cells were transfected to express a firefly luciferase sugarbabe 3′UTR reporter or a version of the reporter with the site mutated. Cells were cotransfected with a renilla luciferase reporter as a control for transfection efficiency. Data show the ratio of firefly to Renilla luciferase activity. Cells were treated with antisense oligonucleotide to deplete miR-14 or with a control oligonucleotide. Data represent mean ± SD for three independent biological replicates. P = 4.9E-05 (Student's t-test).
Figure 4.
Figure 4.
miR-14 effects on nutrient deprivation. (A,B) Survival curves of adult male flies during nutrient deprivation. Flies were reared and aged under controlled conditions and deprived of nutrients at t = 0. Data represent three independent biological replicates. (A) P = 0.105 (36 h) and P = 0.005 (48 h) comparing dilp-Gal4 with dilp-Gal4 UAS-sug. (B) P = 0.045 (36 h) and P = 0.13 (48 h) comparing control w1118 with miR-14 mutant. (C) Partial suppression of the reduced viability of miR-14 mutants by IPC-specific depletion of sugarbabe at 48 h. P = 0.0005 control versus miR-14, UAS-sug-RNAi (without the Gal4 driver, middle); P = 0.001 comparing miR-14 mutant, UAS-sug-RNAi with miR-14 mutant, dilp2-Gal4 UAS-sug-RNAi (with the Gal4 driver). (D) Ratio of triglyceride to protein on nutrient-deprived flies, reared as in B. P = 0.02 (0 h), P = 0.02 (24 h), P = 0.003 (36 h), and P = 0.38 (48 h) comparing control w1118 with miR-14 mutant. (E) Glycogen levels of nutrient-deprived flies, reared as in B. P = 0.001 (0 h), P = 9.28E-05 (24 h), P = 0.06 (36 h), and P = 0.04 (48 h) comparing control w1118 with miR-14 mutant.
Figure 5.
Figure 5.
Responses to nutrient deprivation. (A) sugarbabe mRNA levels measured by qRT–PCR in w1118 control flies reared under controlled conditions. “Starved” indicates flies deprived of nutrients for 24 h. Data represent three independent biological replicates. P = 0.0002. (B) miR-14 miRNA levels measured by qPCR. P = 0.3. (C) sugarbabe mRNA levels compared in control and miR-14 mutants under fed and nutrient-deprived conditions. (D) ilp3, ilp5, and sugarbabe mRNA levels measured by qRT–PCR in dilp2-Gal4/+ control flies and dilp2-Gal4 UAS-sugarbabe (Gal4-directed sugarbabe expression in IPCs) reared and treated as in A. Data represent three independent biological replicates. For ilp3 levels, P = 0.018 comparing fed versus starved control flies; P = 0.007 comparing starved control and sugarbabe-overexpressing flies. For ilp5 levels, P = 0.003 comparing fed and starved control flies; P = 0.0002 comparing starved control and sugarbabe overexpression flies. For sugarbabe levels, P = 0.03 comparing fed and starved control flies; P = 0.01 comparing starved control and sugarbabe-overexpressing flies.

Similar articles

Cited by

References

    1. Böhni R, Riesgo-Escovar J, Oldham S, Brogiolo W, Stocker H, Andruss BF, Beckingham K, Hafen E 1999. Autonomous control of cell and organ size by CHICO, a Drosophila homolog of vertebrate IRS1-4. Cell 97: 865–875 - PubMed
    1. Brennecke J, Hipfner DR, Stark A, Russell RB, Cohen SM 2003. bantam encodes a developmentally regulated microRNA that controls cell proliferation and regulates the pro-apoptotic gene hid in Drosophila . Cell 113: 25–36 - PubMed
    1. Brogiolo W, Stocker H, Ikeya T, Rintelen F, Fernandez R, Hafen E 2001. An evolutionarily conserved function of the Drosophila insulin receptor and insulin-like peptides in growth control. Curr Biol 11: 213–221 - PubMed
    1. Broughton SJ, Piper MD, Ikeya T, Bass TM, Jacobson J, Driege Y, Martinez P, Hafen E, Withers DJ, Leevers SJ, et al. 2005. Longer lifespan, altered metabolism, and stress resistance in Drosophila from ablation of cells making insulin-like ligands. Proc Natl Acad Sci 102: 3105–3110 - PMC - PubMed
    1. Cao C, Brown MR 2001. Localization of an insulin-like peptide in brains of two flies. Cell Tissue Res 304: 317–321 - PubMed

Publication types