. 2010 Dec 14;18(6):590-605.
doi: 10.1016/j.ccr.2010.11.013.

Cooperative epigenetic modulation by cancer amplicon genes

Affiliations

Cooperative epigenetic modulation by cancer amplicon genes

Lixin Rui et al. Cancer Cell. .

Abstract

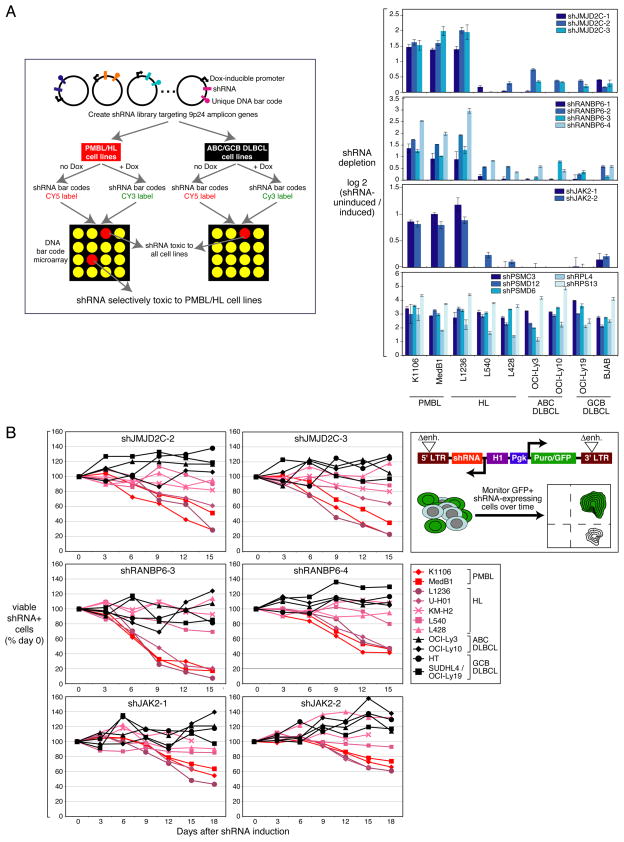
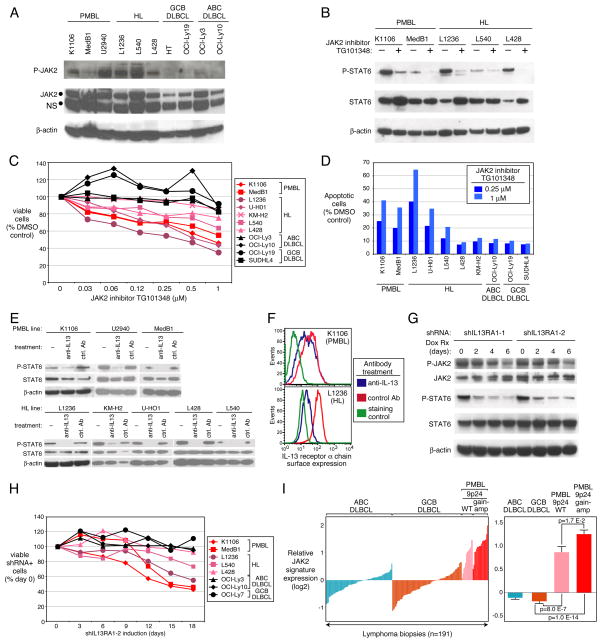
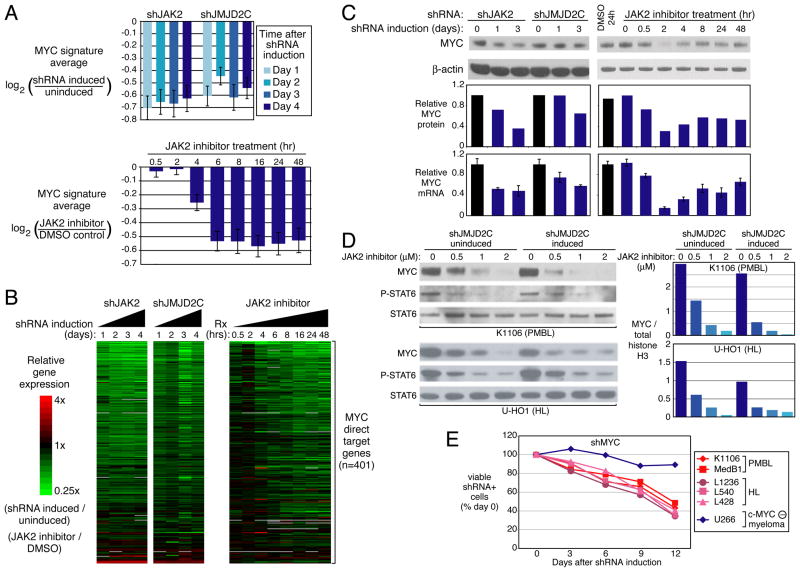
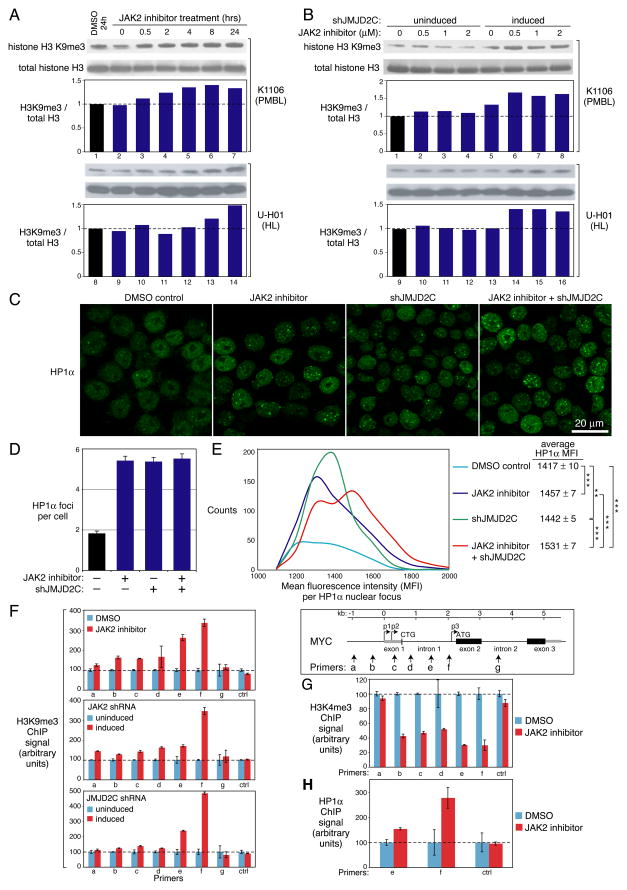
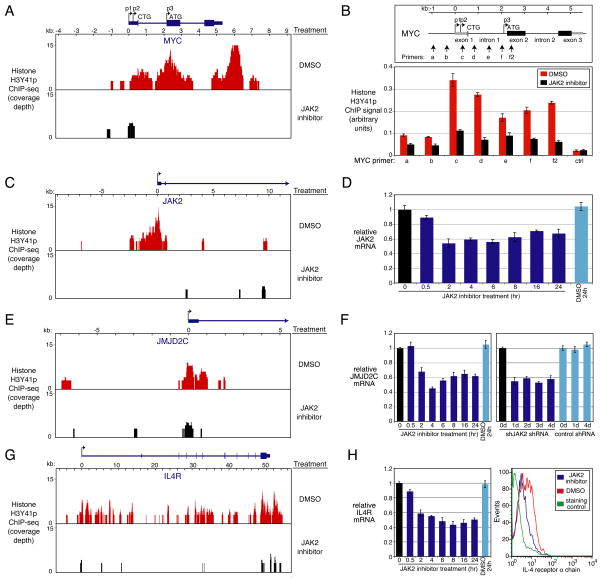
Chromosome band 9p24 is frequently amplified in primary mediastinal B cell lymphoma (PMBL) and Hodgkin lymphoma (HL). To identify oncogenes in this amplicon, we screened an RNA interference library targeting amplicon genes and thereby identified JAK2 and the histone demethylase JMJD2C as essential genes in these lymphomas. Inhibition of JAK2 and JMJD2C cooperated in killing these lymphomas by decreasing tyrosine 41 phosphorylation and increasing lysine 9 trimethylation of histone H3, promoting heterochromatin formation. MYC, a major target of JAK2-mediated histone phosphorylation, was silenced after JAK2 and JMJD2C inhibition, with a corresponding increase in repressive chromatin. Hence, JAK2 and JMJD2C cooperatively remodel the PMBL and HL epigenome, offering a mechanistic rationale for the development of JAK2 and JMJD2C inhibitors in these diseases.


Figures

Figure 1
Figure 1. Chromosome 9p24 amplification and an RNAi screen approach
(A) Array CGH data showing segments of chromosome arm 9p with copy number gains in 18/31 PMBL biopsy samples and in PMBL and HL lines. The box shows the locations of genes in the ~3.5-Mb minimal region of copy number amplification. The 10 genes labeled in red were overexpressed in PMBL cases with the amplicon. (B) Relative expression of 9p24 amplicon genes in cases with and without the amplicon. Shown is the log2-fold overexpression associated with the amplicon along with the t-test p-value for significance. See also Figure S2.
Figure 2
Figure 2. Identification of shRNAs selectively toxic to PMBL and HL cells
(A) Left panel: Schematic of the shRNA library screen to identify the genes on chromosome band 9p24 essential for PMBL and HL cell proliferation and/or survival. Each shRNA vector contains a unique barcode sequence that allows its abundance in a population of transduced cells to be measured by a microarray. In cell lines transduced with the library, shRNAs can be induced by doxycycline (dox). The toxic effect of an shRNA is measured by the relative abundance of each bar code in shRNA-induced vs. uninduced cells. See text and methods for details. Right panel: shRNAs targeting JMJD2C, RANBP6 and JAK2 that were selectively toxic to PMBL and HL cells are displayed. Positive control shRNAs are shown in the bottom panel. Data, expressed as log2-fold changes in shRNA barcode depletion from the shRNA-induced culture, represent means ± SD of 4 parallel infections. (B) Validation of shRNA toxicity. Positive shRNAs (Figure 2A) were expressed using a retroviral vector that co-expressed GFP and were screened for toxicity as indicated in the top right panel. Live shRNA-expressing, GFP+ cells were monitored by flow cytometry over time following shRNA induction. Data were normalized based on cells transduced with a negative control shRNA targeting luciferase. See also Figure S1, Table S1.
Figure 3
Figure 3. Active JAK2-STAT6 required for survival of PMBL and HL cells
(A) Immunoblotting for total and phosphorylated JAK2 protein in the indicated lines. NS: non-specific band. (B) JAK2 kinase inhibition reduces STAT6 phosphorylation. Cells were treated with 2 μM TG101348 for 2 h. (C) Cell viability by MTT assay after 72 h treatment of the indicated lines with TG101348. (D) Flow cytometric analysis of apoptotic cells. The percentage of activated caspase 3-positive cells was calculated relative to cells treated with the DMSO carrier alone. (E–F) The indicated lines were treated with anti-IL-13 antibody (20 μg/ml) or an isotype control antibody for 18 h and analyzed by immunoblotting for total and phosphorylated STAT6 (E) or by flow cytometry for IL13RA1 expression (F). (G) Immunoblotting for the indicated proteins in K1106 cells expressing IL13RA1 shRNAs. (H) Cell survival assay in the indicated lines expressing the IL13RA1-2 shRNA. (I) Left: Average expression of 55 JAK2-regulated genes that are highly expressed in PMBL (Figure S3G) in primary biopsies of the indicated lymphoma categories. Right: Average JAK2 signature expression within each lymphoma category with p-values indicating significantly higher levels in PMBL than in GCB DLBCL. Error bars depict SEM. See also Figure S3.
Figure 4
Figure 4. Cooperative toxicity of JAK2 inhibition and JMJD2C knockdown
(A) The indicated lines were transduced with vectors expressing a JMJD2C shRNA or a control luciferase shRNA. Cells were treated with a range of concentrations of TG101348 (red lines) or the DMSO carrier alone (blue lines) and simultaneously induced for shRNA expression using doxycycline. As controls (green lines), cells were treated with the DMSO carrier and were not induced for shRNA expression. shRNA-expressing cells were monitored by flow cytometry for a co-expressed GFP marker, as described in Figure 2B. The ratio of live GFP-positive cells to GFP-negative cells for each time point was normalized to the day 0 value. (B) Cooperative effect of shRNAs targeting JAK2 and JMJD2C. See text for details. See also Figure S4.
Figure 5
Figure 5. The MYC target gene network depends on JAK2 and JMJD2C in PMBL and HL
(A) Average expression levels of genes belonging to a set of MYC targets (Bild et al., 2006) following knockdown of JAK2 or JMJD2C in K1106 PMBL cells, or treatment with the JAK2 inhibitor TG101348 (2 μM). Expression is illustrated relative to cells without shRNA induction or relative to DMSO-treated cells, as indicated. Error bars depict S.E.M. (B) Relative expression levels of 401 direct MYC target genes (Zeller et al., 2006) in K1106 cells, as treated in Figure 5A, depicted according to the color scale shown. (C) MYC protein levels by immunoblotting and MYC mRNA levels by QPCR (normalized to beta-2-microglobulin mRNA levels) in K1106 cells after JAK2 or JMJD2C knockdown, or after treatment with 2 μM TG101348. mRNA data represent mean ± SD (n=3). (D) Cooperative downregulation of MYC protein by JAK2 and JMJD2C inhibition. K1106 PMBL or U-H01 HL cells were induced for expression of an shRNA targeting JMJD2C for 2 days, or were uninduced. Cells were treated with the indicated concentrations of TG101348 for 2 h and analyzed by immunoblotting as indicated (left). Densitometric analysis of MYC protein levels relative to total histone H3 levels in the indicated samples (right). (E) Knockdown of MYC is toxic to PMBL and HL lines. The U266 myeloma line, which expresses L-MYC but not c-MYC, served as a negative control. See also Figure S5, Table S2.
Figure 6
Figure 6. JAK2 and JMJD2C modulate the epigenome of PMBL and HL
(A) The K1106 PMBL and U-H01 HL lines were treated with the 2 μM TG101348 for the indicated times before immunobloting for H3K9me3 or total histone H3. Relative protein levels were quantitated by densitometry. (B) K1106 or U-H01 cells transduced with JMJD2C shRNAs (shJMJD2C-3 and shJMJD2C-4) were induced for shRNA expression for 2 days, or left uninduced, before treatment with the indicated concentrations of TG101348 for 2h. H3K9me3 and total histone H3 levels were determined by immunoblotting and quantitated by densitometry. The experiment was repeated 3 times with similar results. (C) Representative images of HP1α staining in K1106 cells that were induced to express a JMJD2C shRNA, treated with TG101348, or both. (D) The number of HP1α foci per nucleus was quantitated under the indicated conditions. Data represent mean ± SEM. (E) Histogram of mean fluorescence intensity data from a confocal imaging analysis of HP1α nuclear foci in K1106 cells treated as indicated. ***: p < 0.01; **: p < 0.05, calculated by a two-tailed t-test. (F–H) ChIP analysis of the MYC locus following JMJD2C knockdown or JAK2 inhibition for H3K9me3 (F), H3K4me3 (G) and HP-1α (H). shRNAs targeting JAK2 or JMJD2C were induced in K1106 cells for 2 days, or cells were treated with 2 μM TG101348 for 2 h. Primers from the MYC locus are shown at the upper right. The location of 3 MYC transcriptional start sites (p1, p2, p3) and 2 translation initiation codons (CTG, ATG) are shown. The median value of the signals was first normalized to the input DNA signal. The signals in the shRNA-induced and TG101348-treated samples were further normalized to those from shRNA-uninduced and DMSO-treated samples, respectively. Error bars depict SEM (n=3). See also Figure S6.
Figure 7
Figure 7. JAK2-mediated histone H3Y41 phosphorylation in PMBL and HL
(A) H3Y41p at the MYC locus. Shown are H3Y41p ChIP-seq histograms in K1106 PMBL cells treated with 2 μM TG101348 for 4h or with DMSO as a negative control. (B) ChIP analysis of H3Y41p at the MYC locus with and without treatment with TG101348 (2 μM) for 4h. QPCR was performed using the indicated primers from MYC and negative control primers from the ubiquitin B promoter. The median value of H3Y41p signals was normalized to the input DNA signal. Error bars denote SEM (n=3). (C) H3Y41p at the JAK2 locus, as in Figure 7A. (D) QPCR analysis of JAK2 mRNA levels in K1106 cells treated with 2 μM TG101348 for the indicated times or with DMSO. Error bars depict SEM (n=3). (E) H3Y41p at the JMJD2C locus, as in Figure 7A. (F) QPCR analysis of JMJD2C mRNA levels. K1106 cells were treated as in Figure 7D (left) or induced to express shJAK2-1 or a negative control shRNA for the indicated days (right). Error bars depict SEM (n=3). (G) H3Y41p at the IL4R locus, as in Figure 7A. (H) QPCR analysis of IL4R mRNA levels in K1106 cells, as treated in Figure 7D (left), and FACS analysis of the IL4Rα on the surface of K1106 cells following treatment with 2 μM TG101348 for 18h or with DMSO (right). Error bars depict SEM (n=3). See also Figure S7, Table S3.
Figure 8
Figure 8. Model of cooperative modulation of the cancer epigenome by JAK2 and JMJD2C
Autocrine signaling by IL-13 activates JAK2 kinase in PMBL and HL. Amplification of a genomic region on chromosome band 9p24 increases the abundance of JAK2 and JMJD2C, both of which modify histone H3 tails and impede the recruitment of the heterochromatin protein HP1α. The active chromatin that results facilitates the expression of genes such as MYC, JAK2, JMJD2C, and IL4R. See text for details.

Comment in

Similar articles

Cited by

References

    1. Andrews AL, Holloway JW, Puddicombe SM, Holgate ST, Davies DE. Kinetic analysis of the interleukin-13 receptor complex. J Biol Chem. 2002;277:46073–46078. - PubMed
    1. Bannister AJ, Zegerman P, Partridge JF, Miska EA, Thomas JO, Allshire RC, Kouzarides T. Selective recognition of methylated lysine 9 on histone H3 by the HP1 chromo domain. Nature. 2001;410:120–124. - PubMed
    1. Bentz M, Barth TF, Bruderlein S, Bock D, Schwerer MJ, Baudis M, Joos S, Viardot A, Feller AC, Muller-Hermelink HK, et al. Gain of chromosome arm 9p is characteristic of primary mediastinal B-cell lymphoma (MBL): comprehensive molecular cytogenetic analysis and presentation of a novel MBL cell line. Genes Chromosomes Cancer. 2001;30:393–401. - PubMed
    1. Bild AH, Yao G, Chang JT, Wang Q, Potti A, Chasse D, Joshi MB, Harpole D, Lancaster JM, Berchuck A, et al. Oncogenic pathway signatures in human cancers as a guide to targeted therapies. Nature. 2006;439:353–357. - PubMed
    1. Cloos PA, Christensen J, Agger K, Maiolica A, Rappsilber J, Antal T, Hansen KH, Helin K. The putative oncogene GASC1 demethylates tri- and dimethylated lysine 9 on histone H3. Nature. 2006;442:307–311. - PubMed

Publication types

MeSH terms