. 2011 Feb 1;22(3):354-74.
doi: 10.1091/mbc.E10-09-0756.

Three sorting nexins drive the degradation of apoptotic cells in response to PtdIns(3)P signaling

Affiliations

Three sorting nexins drive the degradation of apoptotic cells in response to PtdIns(3)P signaling

Nan Lu et al. Mol Biol Cell. .

Abstract

Apoptotic cells are swiftly engulfed by phagocytes and degraded inside phagosomes. Phagosome maturation requires phosphatidylinositol 3-phosphate [PtdIns(3)P], yet how PtdIns(3)P triggers phagosome maturation remains largely unknown. Through a genomewide PtdIns(3)P effector screen in the nematode Caenorhabditis elegans , we identified LST-4/SNX9, SNX-1, and SNX-6, three BAR domain-containing sorting nexins, that act in two parallel pathways to drive PtdIns(3)P-mediated degradation of apoptotic cells. We found that these proteins were enriched on phagosomal surfaces through association with PtdIns(3)P and through specific protein-protein interaction, and they promoted the fusion of early endosomes and lysosomes to phagosomes, events essential for phagosome maturation. Specifically, LST-4 interacts with DYN-1 (dynamin), an essential phagosome maturation initiator, to strengthen DYN-1's association to phagosomal surfaces, and facilitates the maintenance of the RAB-7 GTPase on phagosomal surfaces. Furthermore, both LST-4 and SNX-1 promote the extension of phagosomal tubules to facilitate the docking and fusion of intracellular vesicles. Our findings identify the critical and differential functions of two groups of sorting nexins in phagosome maturation and reveal a signaling cascade initiated by phagocytic receptor CED-1, mediated by PtdIns(3)P, and executed through these sorting nexins to degrade apoptotic cells.


Figures
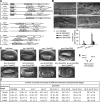
FIGURE 1:
FIGURE 1:
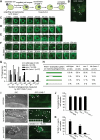
Inactivation of lst-4, snx-1, and snx-6 results in the accumulation of apoptotic cells. (A) Domain structures of LST-4, SNX-1, SNX-6 and their mammalian orthologues. The percentage of amino acid identity (similarity in parentheses) of each domain between the C. elegans protein and each of its mammalian homologues are indicated. SH3: Src homology 3; PX: phox homology; BAR: Bin-amphiphysin-Rvs. (B) (a–d) DIC images of gonads of adult hermaphrodites at 48 h post-L4 stages. Arrows indicate cell corpses. Dorsal is to the top. Scale bars, 20 μm. (e) The number of germ cell corpses per gonad arm in adult hermaphrodites at 24 and 48 h post-L4 stage. Fifteen animals were scored for each datum. (C) DIC images of fourfold stage embryos with indicated genotypes. Arrows indicate persistent somatic cell corpses. Scale bars, 10 μm. (D) The number of somatic cell corpses at different embryonic stages. At least 15 embryos were scored for each datum. Data are presented as mean ± SD. (E) Diagram illustrating that snx-1 and snx-6 act in one genetic pathway and lst-4 acts in another, as indicated by the results in (D).
FIGURE 2:
FIGURE 2:
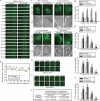
lst-4(tm2423) and snx-1(tm847) mutants are specifically defective in the degradation of cell corpses. (A) Diagram illustrating GFP::RAB-7 (Pced-1 gfp::rab-7) as a reporter for monitoring the degradation of cell corpses and the recruitment of RAB-7 onto phagosomes. (B) The epifluorecent image of a ∼330-min-old embryo. Arrows indicate the C1, C2, and C3 cell corpses. Engulfing cell of each cell corpse was outlined. Scale bar, 10 μm. (C–F) Time-lapse images of phagosome maturation in wild-type or mutant embryos expressing Pced-1 gfp::rab-7. “0 min” represents the time points when phagosomes were just sealed. Scale bars, 2 μm. (G) Histogram distribution of phagosome durations measured from the formation of a nascent phagosome until it was degraded. n, number of phagosomes C1, C2, and C3 scored. (H) The temporal enrichment pattern of GFP::RAB-7 on maturing phagosomes containing somatic cell corpses. Bars depict the duration of phagosomes, and dark and light green colors indicate the duration of the strong and weak signals of GFP::RAB-7 detected on phagosomes. n, number of phagosomes C1, C2, and C3 scored. (I) DIC (a–c) and GFP (d–f) images of adult hermaphrodite gonads expressing GFP::RAB-7 in gonadal sheath cells. Arrows and arrowheads indicated GFP::RAB-7(+) and (−) phagosomes, respectively. The inset in (e) is a serial z-section of the boxed area showing that the cell corpse in the images was fully internalized. Dorsal is to the top. Scale bars, 20 μm. (J) Percentage of engulfed germ cell corpses scored using GFP::RAB-7 as a phagosome marker in adult hermaphrodites at 48 h post-L4 stage. Data are presented as mean ± SD. Fifteen animals were scored for each sample. (K) Percentage of GFP::RAB-7(+) phagosomes in adult hermaphrodites at 48 h post-L4 stage. Data are presented as mean ± SD. Fifteen animals were scored for each sample.
FIGURE 3:
FIGURE 3:
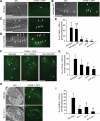
lst-4 and snx-1 are both required for the efficient incorporation of lysosomes and early endosomes to phagosomes. (A–D) DIC and epifluorecent images of adult hermaphrodite gonads expressing Pced-1ctns-1::gfp. Arrows indicate phagosomes containing germ cell corpses. Arrowheads in (B) indicate nascent phagosomes not yet labeled with CTNS-1::GFP. γ-Irradiation (IR) was used in (B) to increase the number of apoptotic cells in wild-type animals. Scale bars, 20 μm. (E, G, and I) Data are presented as mean ± SD. Fifteen animals were scored for each sample. Independent Student’s t-test was used to calculate P values between wild-type and mutant animals. NS: not significant. *, P < 0.005; **, P < 0.001. (E) The percentage of CTNS-1::GFP(+) phagosomes in adult hermaphrodite gonads at 48 h post-L4 stage. (F) Epifluorecent images of 1.5-fold stage embryos expressing Pced-1ctns-1::gfp. Arrowheads indicate CTNS-1::GFP particles in hypodermal cells. An arrow indicates CTNS-1::GFP(+) phagosome. Scale bars: 10 μm. (G) The percentage of CTNS-1::GFP(+) phagosomes in 1.5-fold stage embryos. (H) DIC (a and c) and epifluorecent (b and d) images of 1.5-fold stage embryos expressing Pced-1hgrs-1::gfp. Arrows indicate phagosomes. Scale bars: 10 μm. (I) The percentage of HGRS-1::GFP(+) phagosomes in 1.5-fold stage embryos.
FIGURE 4:
FIGURE 4:
LST-4 and SNX-1 are important for the extension of membrane tubules from the surface of phagosomes. (A–D) Time-lapse images of membrane tubules extended from phagosomes in embryos expressing Pced-1ctns-1::gfp. Arrows, arrowheads, and open arrowheads indicate phagosomes, membrane tubules, and lysosomal particles, respectively. Scare bar, 2 μm. (A) An extended membrane tubule from a C2 phagosome quickly captured and fused with a close-by lysosome in a wild-type embryo. (B) An attempted but failed capture of a lysosome by a membrane tubule extended from phagosome C3. (C and D) The time-lapse recording of the dynamic extension of membrane tubules from C3 phagosomes in a wild-type embryo (C) and in a lst-4(tm2423);snx-1(tm847) mutant embryo (D). (E) The average number of independent tubules detected on C1, C2, and C3 phagosomes in 15-min recording periods with 20-s intervals, starting immediately after the completion of engulfment. At least five C1, C2, or C3 phagosomes were scored for each datum point. Independent Student’s t-test was used to calculate the P values of comparisons between wild-type and mutant animals. *, P < 0.05.
FIGURE 5:
FIGURE 5:
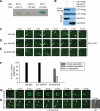
LST-4 and DYN-1 depend on each other for their association to phagosomal surfaces. (A and B) The interaction between DYN-1 and LST-4 was detected in the yeast two-hybrid assay (A) and the coimmunoprecipitation assay (B). Protein interactions were detected in (A) by X-Gal assays and in (B) by immunoblotting Flag-tagged LST-4 that was coimmuniprecipitated with HA-tagged proteins. CED-1C (the cytoplasmic domain of CED-1), CED-12, and CED-6 are negative controls to demonstrate the specificity of LST-4/DYN-1 interaction. (C–E) Time-lapse recording of the recruitment of DYN-1::GFP onto C2 phagosomes in a wild-type embryo (C), a snx-1(tm847) mutant embryo (D), and a lst-4(tm2423) mutant embryo (E). “0 min”: the time point when the engulfment was just completed. Arrowheads mark DYN-1::GFP puncta associating with phagosomes. Scale bars: 2 μm. (F) Quantification of different dynamic DYN-1::GFP localization patterns on phagosomes by monitoring multiple C1, C2, and C3 phagosomes over time. At least 16 phagosomes were monitored for each genotype. (G and H) Time-lapse images showing the dynamic recruitment of LST-4(d)::GFP onto a C3 phagosome in a wild-type embryo (G) or the lack of it in a dyn-1(en9) mutant embryo (H). “0 min”: the time point when the engulfment was just completed. Arrows in (H) indicate the C3 phagosome. Arrowheads in (H) indicate cytoplasmic LST(d)::GFP(+) puncta, which are surrounding but not associating with the C3 phagosome. The cell boundary of the engulfing cell for the C3 cell corpse is outlined in (H[a]). (H[j]) The DIC images corresponding to (H[a]) that indicates the position of the C3 phagosome. Scale bars: 4 μm.
FIGURE 6:
FIGURE 6:
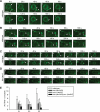
LST-4::GFP and SNX-1::GFP are transiently localized on maturing phagosomes. All GFP reporters are expressed under the control of Pced-1 promotor. (A and B) GFP and DIC images of wild-type gonad arms (A) or embryos (B) expressing indicated reporters. Arrows indicate phagosomes. Scale bars in (A) and (B), 20 and 10 μm, respectively. (C and D) Time-lapse images displaying LST-4(d)::GFP (C) or SNX-1::GFP (D) on maturing phagosomes in wild-type embryos. “0 min” represents the time point when engulfment is just complete. Scale bars, 2 μm. (E) The temporal order and duration of each fluorescent reporter on extending pseudopods and maturing phagosomes. Data represent means obtained from time-lapse recording of multiple C1, C2, and C3 cell corpses (n, number of phagosomes measured). The light and dark green colors reflect weak and strong signal intensities, respectively. The average phagosomal durations of LST-4(d) and SNX-1 are indicated as mean ± SD. “0 min” represents the time when pseudopod extension is just initiated. (F) Percentage of phagosomes labeled with indicated GFP reporters in 1.5-fold stage wild-type or vps-34(h510); F39B1.1(tm3171) mutant embryos. At least 15 animals were scored for each sample. *, P < 0.001 by independent Student’s t-test. (G and H) Time-lapse images showing the localization of SNX-1::GFP (G) or LST-4(d)::GFP (H) on the tubules extended from phagosomes. Arrowheads indicate GFP-labeled phagosomal tubules. Scale bar: 2 μm.
FIGURE 7:
FIGURE 7:
SNX-1 physically interacts with SNX-6 and recruits SNX-6 onto phagosomes. (A) A yeast two-hybrid assay testing the binary interaction among SNX-1, SNX-6, and LST-4. Protein interactions were visualized by X-Gal assays. (B) GST-pull down assay showing that purified recombinant GST-SNX-6 specifically interacts with SNX-1-HA expressed in 293T cells. The SDS–PAGE gel image (right) shows purified proteins used for GST-pull down assay. (C–E) Time-lapse images monitoring GFP and mRFP signals on maturing phagosomes in wild-type (C and D) or snx-1(tm847) mutant (E) embryos expressing Pced-1 snx-6::gfp alone (D and E) or coexpressing Pced-1 snx-6::gfp and Pced-1 snx-1::mrfp (C). SNX-6::GFP and SNX-1::mRFP signals on phagosomes are indicated by arrows. Colocalization of SNX-6::GFP and SNX-1::mRFP on cytoplasmic puncta are indicated by arrowheads. “0 min” represents the time point when phagosomes are just sealed. Scale bars, 2 μm.
FIGURE 8:
FIGURE 8:
The localization patterns of LST-4 and SNX-1 on phagosomes are primarily controlled by the ced-1 pathway. (A–D) and (F–I) Time-lapse images of indicated GFP reporters on maturing phagosomes in wild-type (A and F) or ced mutant embryos (B–D and G–I) expressing Pced-1lst-4(d)::gfp or Pced-1 snx-1::gfp, respectively. Arrows indicated GFP signals on phagosomes. “0 min” represents the time point when the phagosome is just sealed. Scale bars, 2 μm. (E and J) Quantification of the different localization patterns of LST-4(d)::GFP (E) and SNX-1::GFP (J) on phagosomes in wild-type and ced-1 or ced-5 mutant embryos. Types of localization patterns are defined as follows: “normal recruitment,” GFP(+) circles were detected on phagosomes within 8 min after the engulfment was completed; “delayed recruitment,” GFP(+) circles were detected on the phagosomes at least 10 min after the engulfment was completed; “no recruitment,” GFP signals were not detected on the phagosomes for a period > 50 min starting from the completion of engulfment; “short association,” the GFP signal was recruited to phagosomes at the normal time point, yet quickly disappeared from phagosomal surfaces.
FIGURE 9:
FIGURE 9:
The membrane localization of CED-1 in engulfing cells and its phagosome maturation-promoting activity are not affected by the snx mutations. (A) Time-lapse images monitoring the level of CED-1::GFP on the plasma membrane of engulfing cell ABplaapppp during and after the engulfment of cell corpse C3 (arrowhead) in wild-type and snx-1(tm847) mutant embryos. “0 min” indicates the time point when pseudopods start to extend around C3. The rectangle frames label the region from which the plasma membrane-associated GFP levels were measured and plotted in (B). (B) The fluorescence intensity of plasma membrane-associated CED-1::GFP within the framed region in (A) were measured at different time points, normalized to the GFP intensity at “0 min,” and plotted overtime. (C) CED-1::GFP is presented on the plasma membranes in snx-1(tm847) mutant embryos as in wild-type embryos at four different embryonic stages. CED-1::GFP is expressed from enIs7, an integrated transgenic array of the Pced-1ced-1::gfp reporter. White arrows indicate plasma membrane-localized CED-1::GFP. Yellow arrowheads indicate CED-1::GFP on phagosomal surfaces. Scale bar: 5 μm. (D–F) Time-lapse images monitoring the dynamic pattern of PtdIns(3)P production (D) and GFP::RAB-5 recruitment (E) on phagosomal surfaces. “0 min” represents the time point when engulfment is just completed. Scar bar: 2 μm. The quantification data of (D) and (E), obtained by monitoring multiple C1, C2, and C3 phagosomes over time, are shown in (F). n, number of phagosomes analyzed. (G–J) Overexpression of CED-1::GFP does not significantly rescue the Ced defect of snx mutant embryos. Bars represent average numbers of somatic cell corpses scored at different embryonic stages. Error bars represent standard deviation. Fifteen embryos were scored for each data point. enIs7 is an integrated transgenic array that expressed multiple copies of Pced-1 ced-1::gfp. *, **, and NS indicate p < 0.05, p < 0.01, and not significant (p > 0.05), respectively (independent Student’s t-test).
FIGURE 10:
FIGURE 10:
A PtdIns(3)P-mediated signaling pathway that drives the degradation of apoptotic cells. (A) Diagram of the pathway. The phagocytic receptor CED-1 and its adaptor CED-6 recruit the large GTPase DYN-1 to phagosomal surfaces, an event resulting in the robust production of phagosomal PtdIns(3)P, which in turn recruits LST-4, SNX-1, and SNX-6 from cytosol to phagosomal surfaces. These PtdIns(3)P effectors act in two parallel and partially redundant pathways to induce the extension of membrane tubules from phagosomes. In addition, LST-4 interacts with DYN-1 (Dynamin) and stabilizes its association with phagosome, which recruits and stabilizes the association of RAB-7 with phagosomes. Both RAB-7 and phagosome tubules facilitate efficient endosomes/phagosome and lysosomes/phagosome fusions and ultimately result in the degradation of apoptotic cells. (B) A model indicating the two distinct PtdIns(3)P effector complexes on phagosomal surfaces. One complex include SNX-1 and SNX-6 (may also contain VPS-29), in which SNX-1 interacts with PtdIns(3)P and brings SNX-6 onto phagosomes. In the second complex, LST-4, perhaps as homodimers, interacts with both PtdIns(3)P and DYN-1, which are enriched on phagosomes, and stabilize the association of the whole complex with phagosomes. (C) Model proposing that the PtdIns(3)P effectors use their BAR domains to induce and/or stabilize the formation of phagosomal tubules, which facilitates the recruitment and fusion of intracellular organelles to phagosomes.

Similar articles

Cited by

References

    1. Backer JM. The regulation and function of Class III PI3Ks: novel roles for Vps34. Biochem J. 2008;410:1–17. - PubMed
    1. Bai C, Elledge SJ. Gene identification using the yeast two-hybrid system. Methods Enzymol. 1997;283:141–156. - PubMed
    1. Birkeland HC, Stenmark H. Protein targeting to endosomes and phagosomes via FYVE and PX domains. Curr Top Microbiol Immunol. 2004;282:89–115. - PubMed
    1. Bloom L, Horvitz HR. The Caenorhabditis elegans gene unc-76 and its human homologs define a new gene family involved in axonal outgrowth and fasciculation. Proc Natl Acad Sci USA. 1997;94:3414–3419. - PMC - PubMed
    1. Bonifacino JS, Hurley JH. Retromer. Curr Opin Cell Biol. 2008;20:427–436. - PMC - PubMed

Publication types

MeSH terms

LinkOut - more resources