Comparative Study
. 2010 Dec 9;68(5):843-56.
doi: 10.1016/j.neuron.2010.11.021.

Superresolution imaging of chemical synapses in the brain

Affiliations
Comparative Study

Superresolution imaging of chemical synapses in the brain

Adish Dani et al. Neuron. .

Abstract

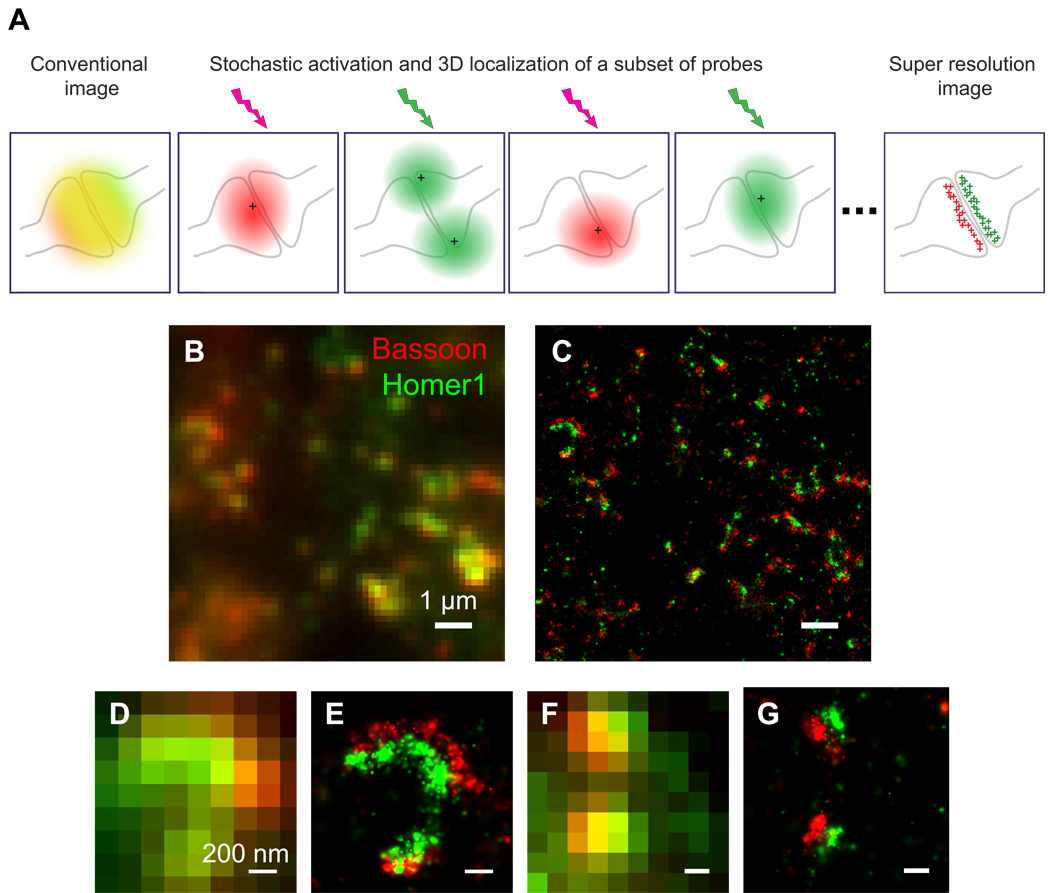
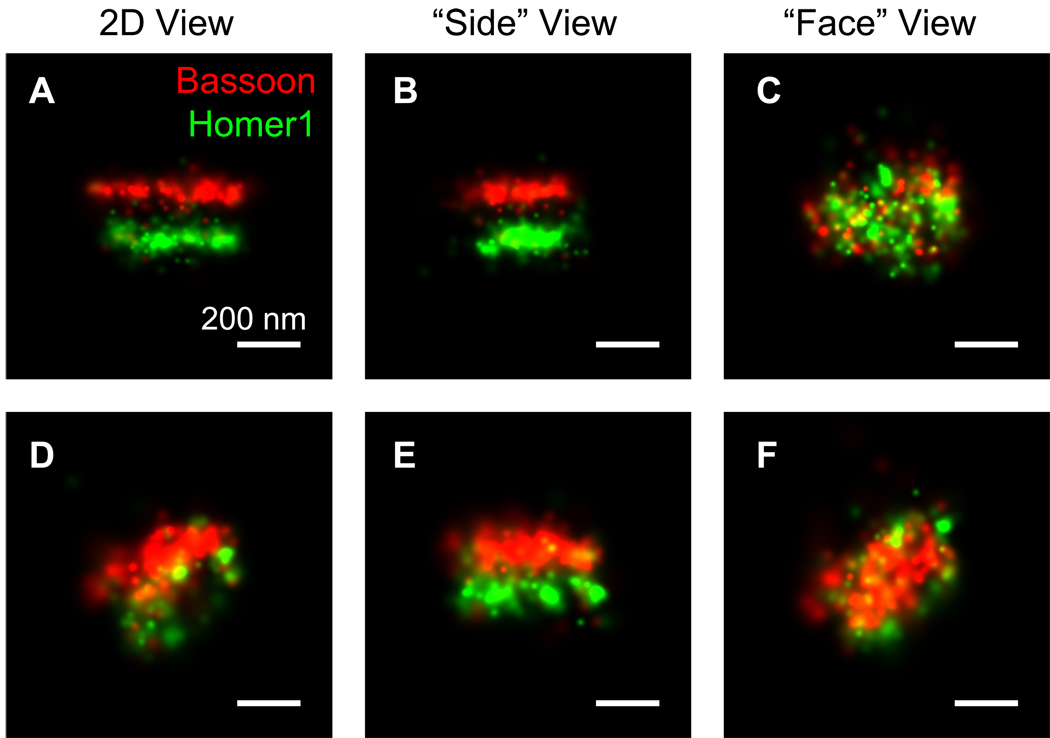
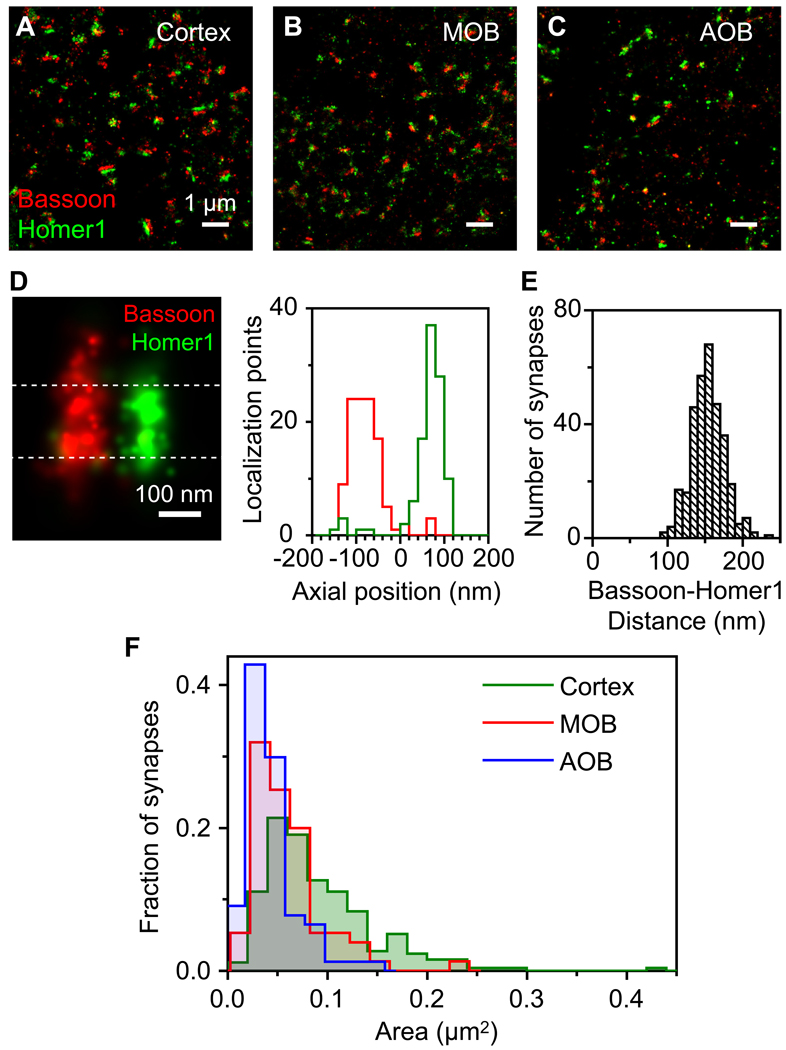
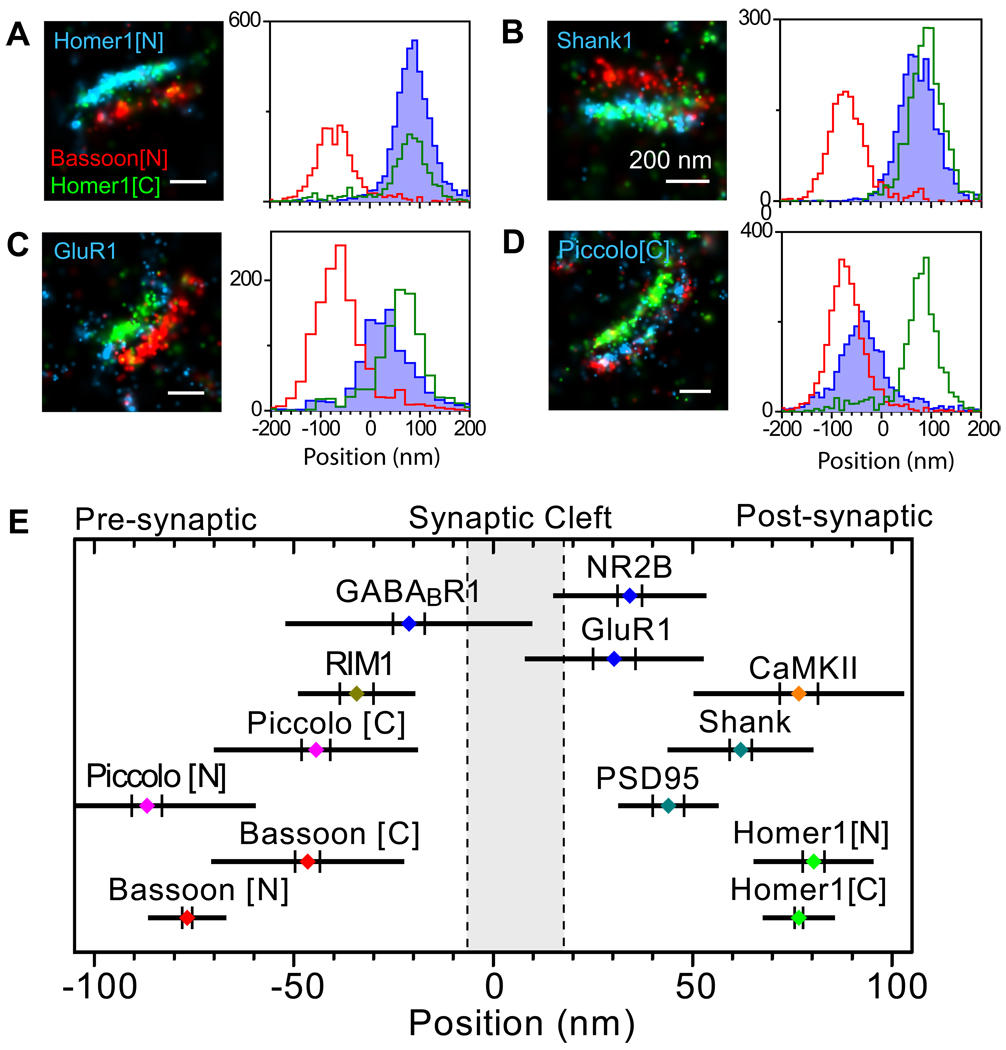
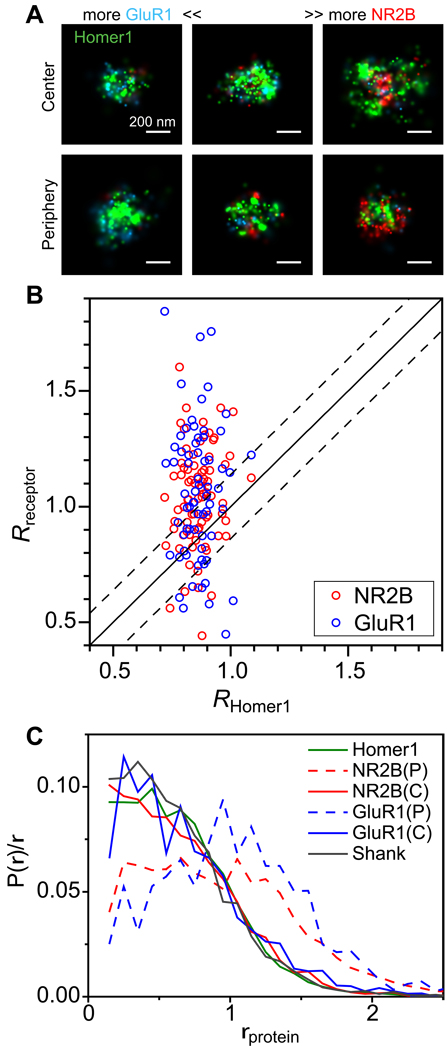
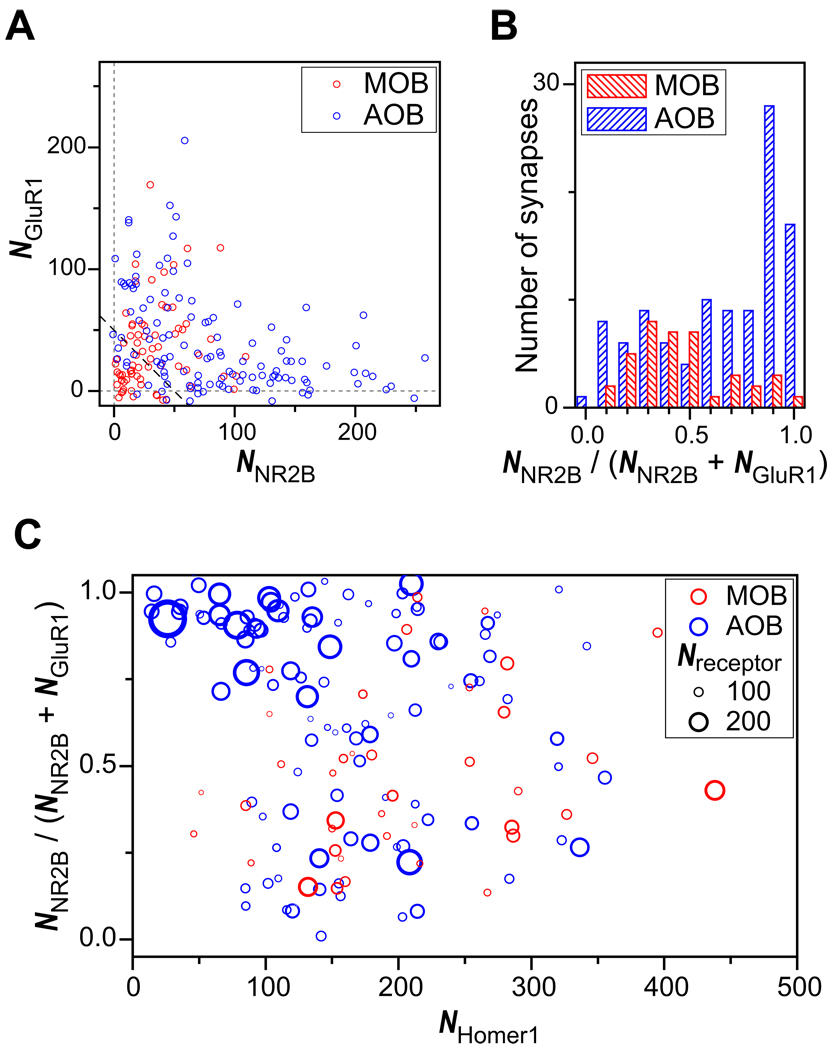
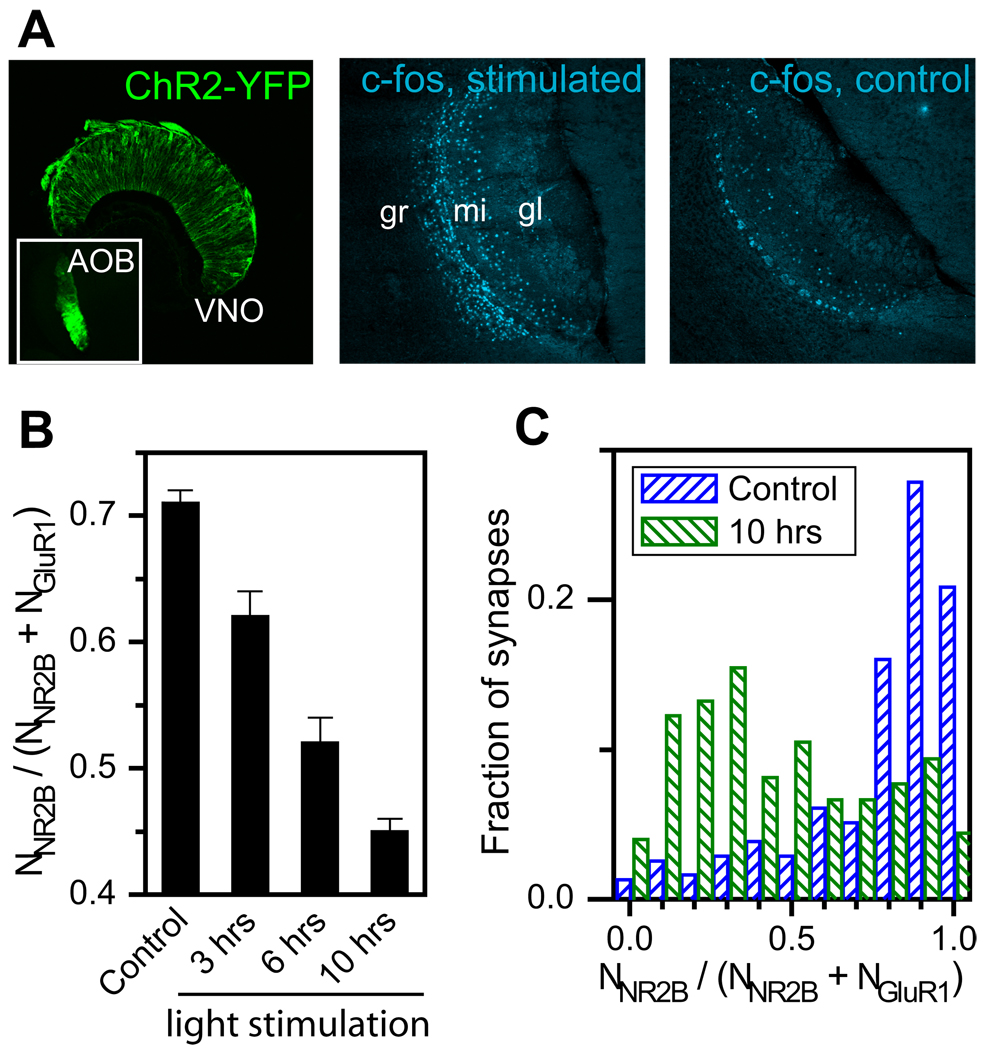
Determination of the molecular architecture of synapses requires nanoscopic image resolution and specific molecular recognition, a task that has so far defied many conventional imaging approaches. Here, we present a superresolution fluorescence imaging method to visualize the molecular architecture of synapses in the brain. Using multicolor, three-dimensional stochastic optical reconstruction microscopy, the distributions of synaptic proteins can be measured with nanometer precision. Furthermore, the wide-field, volumetric imaging method enables high-throughput, quantitative analysis of a large number of synapses from different brain regions. To demonstrate the capabilities of this approach, we have determined the organization of ten protein components of the presynaptic active zone and the postsynaptic density. Variations in synapse morphology, neurotransmitter receptor composition, and receptor distribution were observed both among synapses and across different brain regions. Combination with optogenetics further allowed molecular events associated with synaptic plasticity to be resolved at the single-synapse level.


Figures

Figure 1
Figure 1. STORM imaging of pre- and postsynaptic scaffolding proteins
(A) Schematic of 3D STORM. For molecules that give overlapping images (represented by the colored region in the left panel), STORM resolves these molecules by stochastically activating them at different times during image acquisition. At any time, only a sparse, optically resolvable subset of molecules are activated, allowing their images (represented by the red and green ellipsoids in the middle panels) to be separated from each other and their 3D positions (represented by the crosses in the middle panels) to be precisely determined from the centroid positions and ellipiticities of these images. Iteration of this process allows the positions of many molecules to be determined and a super-resolution image to be reconstructed from these positions (represented by the red and green crosses right panel). (B–G) Presynaptic protein Bassoon and postsynaptic protein Homer1 in the mouse MOB glomeruli were identified by immunohistochemistry using Cy3-A647 and A405-A647 conjugated antibodies, respectively. The conventional fluorescence image (B) shows punctate patterns that are partially overlapping, whereas the STORM image (C) of the same area clearly resolves distinct synaptic structures. Further zoom-in of the conventional images (D, F) does not reveal detailed structure of the synapses whereas the corresponding STORM images (E, G) distinguish the presynaptic Bassoon and postsynaptic Homer1 clusters.
Figure 2
Figure 2. 3D STORM images of synapses
Despite different orientations of synapses (A–C and D–F), 3D imaging allows the visualization of presynaptic Bassoon and postsynaptic Homer1 as well-separated elliptical disks in different viewing angles. The “side” views represent projection images with the trans-synaptic axis rotated into the viewing plane, and the “face” views represent projection images with trans-synaptic axis rotated perpendicular to the viewing plane.
Figure 3
Figure 3. Quantification of synaptic morphology in distinct regions of the brain
(A–C) STORM images of Bassoon and Homer1 from the Cortex (A), MOB (B) and AOB (C) regions in the same mouse brain section. (D) To determine the separation between Bassoon and Homer1 clusters, the distribution of localization points (within a ~160 nm thick region at the center of the synapse defined by the dashed lines) along the trans-synaptic axis was measured and fit with Gaussian functions, and the distance between the centroid positions of the two Gaussians were defined as Bassoon-Homer1 distances. (E) The histogram of Bassoon-Homer1 distances of 327 synapses in mouse MOB glomeruli. (F) Normalized distribution of the active zone area of excitatory synapses, measured from the sum of the bassoon and Homer1 signals. A total of 252 synapses in the cortex, 75 synapses in the MOB and 77 synapses in the AOB were measured.
Figure 4
Figure 4. Axial positions of synaptic proteins
(A–D) Various synaptic proteins (blue) were imaged together with Bassoon[N] (red) and Homer1[C] (green). For each protein, the left panel shows a typical three-color image of a single synapse and the right panel displays the localization distribution along the trans-synaptic axis derived from multiple synapses. The images and axial position distributions of Homer1[N], Shank1, GluR1, and Piccolo[C] are shown here. The axial distributions of PSD-95, CamKII, NR2B, GABABR1, Piccolo[N], Bassoon[C] and RIM1 are shown in Figure S3. (E) A composite plot of the axial positions of all synaptic proteins imaged in this work. For each protein, the colored dot specifies the mean axial position, the two vertical lines represent the associated SEM, and the half length of the horizontal bar denotes the SD, primarily arising from synapse-to-synapse variation.
Figure 5
Figure 5. Radial (lateral) distribution of glutamate neurotransmitter receptors at synapses
AMPA receptor subunit GluR1 and NMDA receptor subunit NR2B were imaged together with Homer1. (A) “Face” views of six example synapses with the top row representing a population of synapses in which the receptor subunits take a more central distribution within the PSD and the bottom row representing a population of synapses with a more peripheral receptor distribution near the edge of the PSD. The left to right columns show synapses with mostly GluR1, both GluR1 and NR2B, and mostly NR2B, respectively. (B) Comparison of the mean radial position R of NR2B and GluR1 in individual synapses with the R value of Homer1. The solid line is the y = x line and the dashed lines are the ± 2×SD boundary calculated from the standard deviation of RHomer1. (C) Radial distribution of receptors of the two populations of synapses divided according to the upper 2×SD boundary of RHomer1. We refer to these two populations as the central (C) population (RreceptorRHomer1 + 2×SD) and the peripheral (P) populations (Rreceptor > RHomer1 + 2×SD). The radial distributions of NR2B (red lines) and GluR1 (blue lines) are displayed together with those of Homer1 (green) and Shank1 (black).
Figure 6
Figure 6. Composition of glutamate neurotransmitter receptors at synapses
(A) Number of NR2B localization points (NNR2B) versus number of GluR1 localization points (NGluR1) for each synapse in the AOB and MOB. The correlation coefficient between NNR2B and NGluR1 is −0.42 in the AOB and 0.23 in the MOB. (B) The histograms of NR2B fraction (NNR2B / (NNR2B + NGluR1)) for synapses in the MOB and AOB regions. (C) A scatter plot of the NR2B fraction in relation with the number of Homer1 localization points (NHomer1) for each synapse in the AOB and MOB. The circle diameters are proportional to the total number of receptor localizations. Structures with the total number of receptor localization points smaller than 50 (data points below the dashed line in (A)) are not included in (B) and (C), as a low total number of receptor localizations introduces a large error in the NNR2B / (NNR2B + NGluR1) calculation.
Figure 7
Figure 7. Changes in the receptor composition of AOB synapses in response to VNO stimulation
(A) Light-activation of VNO neurons expressing ChR2-YFP in ORC-V mice. (left panel) YFP image of the VNO neurons. Inset, YFP image of the AOB showing ChR2-YFP expression in the glomerular region. (Middle panel) Immunofluorescence image of c-fos in the AOB two hours after light stimulation. gr: granule cell; mi: mitral cell; gl: glomerular layers. (right panel) c-fos image in the AOB of a control mouse that was similarly light stimulated but does not express ChR2-YFP in the VNO. (B) Average value of NNR2B / (NNR2B + NGluR1) derived from many AOB synapses sampled at various times after light stimulation of the ChR2-YFP expressing VNO neurons in ORC-V mice and in control ChR2-YFP expressing ORC-V littermates without light stimulation. (C) Distribution of NNR2B / (NNR2B + NGluR1) constructed from individual AOB synapse in ChR2-YFP expressing mice 10 hours after light stimulation and in control ChR2-YFP expressing mice without light stimulation.

Similar articles

Cited by

References

    1. Adesnik H, Nicoll RA, England PM. Photoinactivation of native AMPA receptors reveals their real-time trafficking. Neuron. 2005;48:977–985. - PubMed
    1. Antal M, et al. Numbers, densities, and colocalization of AMPA- and NMDA-type glutamate receptors at individual synapses in the superficial spinal dorsal horn of rats. J Neurosci. 2008;28:9692–9701. - PMC - PubMed
    1. Arthur CP, Serrell DB, Pagratis M, Potter DL, Finch DS, Stowell MH. Electron tomographic methods for studying the chemical synapse. Methods Cell Biol. 2007;79:241–257. - PubMed
    1. Bates M, Huang B, Dempsey GT, Zhuang XW. Multicolor super-resolution imaging with photo-switchable fluorescent probes. Science. 2007;317:1749–1753. - PMC - PubMed
    1. Ben-Shaul Y, Katz LC, Mooney R, Dulac C. In vivo vomeronasal stimulation reveals sensory encoding of conspecific and allospecific cues by the mouse accessory olfactory bulb. Proc Natl Acad Sci U S A. 2010;107:5172–5177. - PMC - PubMed

Publication types

MeSH terms

Substances