

Epithelial cell transforming sequence 2 in human oral cancer
- PMID: 21124766
- PMCID: PMC2993930
- DOI: 10.1371/journal.pone.0014082
Epithelial cell transforming sequence 2 in human oral cancer
Abstract
Background: Epithelial cell transforming sequence 2 (ECT2) is a guanine nucleotide exchange factor for Rho family GTPase, which has been implicated in the malignant phenotype of human cancers. Little is known about the effect of a high level of ECT2 in regulating oral cancer cell behavior. In this study, we investigated the involvement of ECT2 in oral squamous cell carcinoma (OSCC).
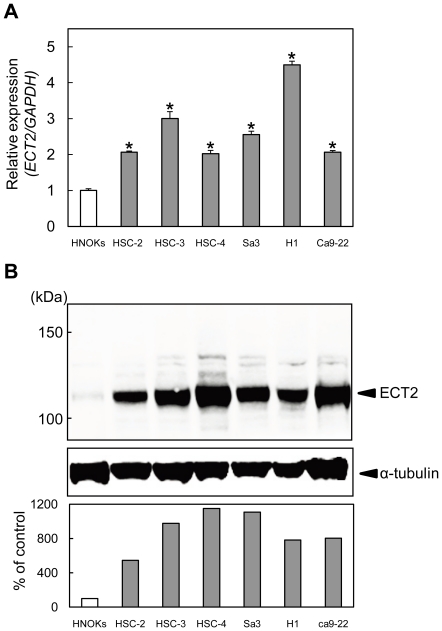
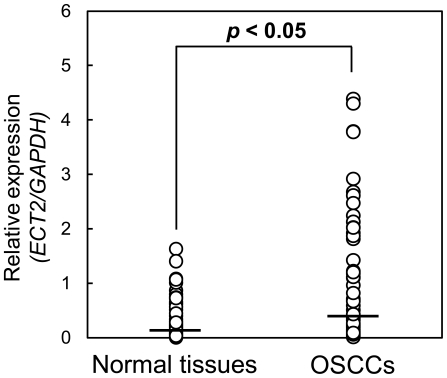
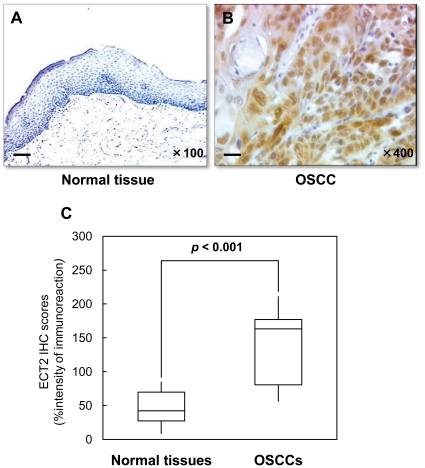
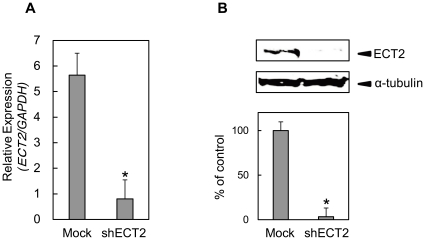
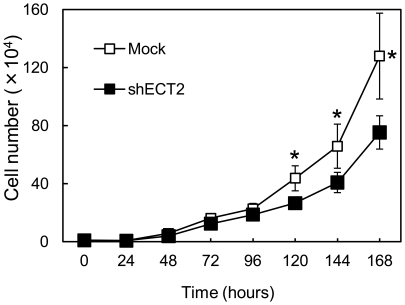
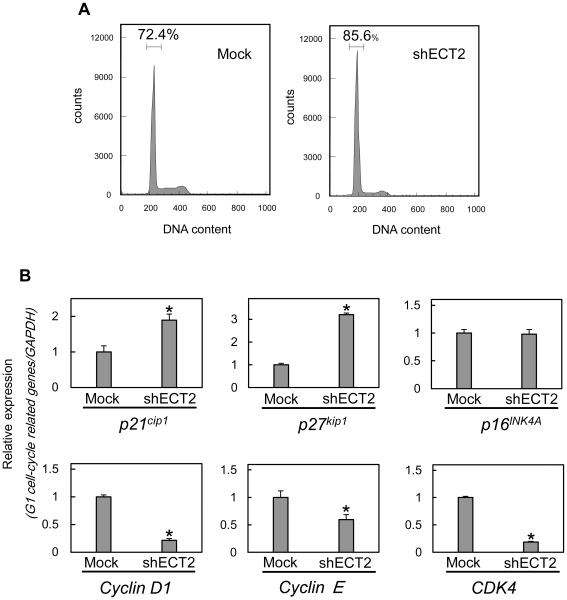
Methodology/principal findings: We analyzed ECT2 expression in OSCC-derived cell lines and primary OSCCs compared with matched normal tissue (n = 96) by quantitative reverse transcriptase-polymerase chain reaction, Western blot, and immunohistochemistry. We then evaluated the correlation between the ECT2 expression status in primary OSCCs and the clinicopathological features. ECT2 expression was significantly up-regulated in OSCCs in vitro and in vivo (p<0.05). Among the clinical variables analyzed, higher ECT2 expression also was associated with the TNM stage grading (p<0.05). When we performed functional analyses of ECT2 in OSCC-derived cells using the shRNA system, the cellular proliferation of the ECT2 knockdown cells decreased significantly compared with the control cells (p<0.05). Cell cycle analysis by flow cytometry showed arrest of cell cycle progression at the G1 phase in the ECT2 knockdown cells. We also found up-regulation of the Cip/Kip family of the cyclin-dependent kinase inhibitors, p21(cip1) and p27(kip1), and down-regulation of cyclin D1, cyclin E, and CDK4. These data suggested that the elevated Cip/Kip family induced inhibition of the cyclin D1-CDK complex activity leading to cell cycle arrest at the G1 phase.
Conclusions/significance: Our results proposed for the first time that ECT2 is an indicator of cellular proliferation in OSCCs and that ECT2 might be a potential therapeutic target for the development of new treatments for OSCCs.
Conflict of interest statement
Figures
Similar articles
-
TEAD4-YAP interaction regulates tumoral growth by controlling cell-cycle arrest at the G1 phase.Biochem Biophys Res Commun. 2017 Apr 29;486(2):385-390. doi: 10.1016/j.bbrc.2017.03.050. Epub 2017 Mar 14. Biochem Biophys Res Commun. 2017. PMID: 28315328
-
Semaphorin7A Promotion of Tumoral Growth and Metastasis in Human Oral Cancer by Regulation of G1 Cell Cycle and Matrix Metalloproteases: Possible Contribution to Tumoral Angiogenesis.PLoS One. 2015 Sep 17;10(9):e0137923. doi: 10.1371/journal.pone.0137923. eCollection 2015. PLoS One. 2015. PMID: 26378920 Free PMC article.
-
Overexpression of CDCA2 in human squamous cell carcinoma: correlation with prevention of G1 phase arrest and apoptosis.PLoS One. 2013;8(2):e56381. doi: 10.1371/journal.pone.0056381. Epub 2013 Feb 13. PLoS One. 2013. PMID: 23418564 Free PMC article.
-
UBE2S associated with OSCC proliferation by promotion of P21 degradation via the ubiquitin-proteasome system.Biochem Biophys Res Commun. 2017 Apr 15;485(4):820-825. doi: 10.1016/j.bbrc.2017.02.138. Epub 2017 Feb 28. Biochem Biophys Res Commun. 2017. PMID: 28257844
-
The role of p21Waf1/CIP1 as a Cip/Kip type cell-cycle regulator in oral squamous cell carcinoma (Review).Med Oral Patol Oral Cir Bucal. 2013 Mar 1;18(2):e219-25. doi: 10.4317/medoral.18213. Med Oral Patol Oral Cir Bucal. 2013. PMID: 23385498 Free PMC article. Review.
Cited by
-
Molecular pathways: induction of polyploidy as a novel differentiation therapy for leukemia.Clin Cancer Res. 2013 Nov 15;19(22):6084-8. doi: 10.1158/1078-0432.CCR-12-2604. Epub 2013 Aug 20. Clin Cancer Res. 2013. PMID: 23963861 Free PMC article.
-
Epigenetic Regulation in Oral Squamous Cell Carcinoma Microenvironment: A Comprehensive Review.Cancers (Basel). 2023 Nov 27;15(23):5600. doi: 10.3390/cancers15235600. Cancers (Basel). 2023. PMID: 38067304 Free PMC article. Review.
-
Adenosine A2b receptor promotes progression of human oral cancer.BMC Cancer. 2015 Jul 31;15:563. doi: 10.1186/s12885-015-1577-2. BMC Cancer. 2015. PMID: 26228921 Free PMC article.
-
Integrating bioinformatics and machine learning methods to analyze diagnostic biomarkers for HBV-induced hepatocellular carcinoma.Diagn Pathol. 2024 Aug 2;19(1):105. doi: 10.1186/s13000-024-01528-8. Diagn Pathol. 2024. PMID: 39095799 Free PMC article.
-
Exocyst complex component Sec8: a presumed component in the progression of human oral squamous-cell carcinoma by secretion of matrix metalloproteinases.J Cancer Res Clin Oncol. 2013 Apr;139(4):533-42. doi: 10.1007/s00432-012-1356-2. Epub 2012 Dec 4. J Cancer Res Clin Oncol. 2013. PMID: 23207790
References
-
- Sudbo J, Reith A. The evolution of predictive oncology and molecular-based therapy for oral cancer prevention. Int J Cancer. 2005;115:339–345. - PubMed
-
- Mashberg A, Boffetta P, Winkelman R, Garfinkel L. Tobacco smoking, alcohol drinking, and cancer of the oral cavity and oropharynx among U.S. veterans. Cancer. 1993;72:1369–1375. - PubMed
-
- Macfarlane GJ, Zheng T, Marshall JR, Boffetta P, Niu S, et al. Alcohol, tobacco, diet and the risk of oral cancer: A pooled analysis of three case-control studies. European Journal of Cancer Part B: Oral Oncology. 1995;31:181–187. - PubMed
-
- Fearon ER, Vogelstein B. A genetic model for colorectal tumorigenesis. Cell. 1990;61:759–767. - PubMed
-
- Marshall CJ. Tumor suppressor genes. Cell. 1991;64:313–326. - PubMed
Publication types
MeSH terms
Substances
LinkOut - more resources
Full Text Sources
Medical
Research Materials
Miscellaneous
