Preferential infection and depletion of Mycobacterium tuberculosis-specific CD4 T cells after HIV-1 infection
- PMID: 21115690
- PMCID: PMC3005236
- DOI: 10.1084/jem.20100090
Preferential infection and depletion of Mycobacterium tuberculosis-specific CD4 T cells after HIV-1 infection
Abstract
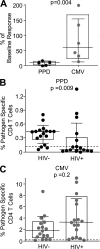
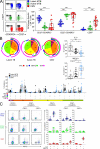
HIV-1 infection results in the progressive loss of CD4 T cells. In this study, we address how different pathogen-specific CD4 T cells are affected by HIV infection and the cellular parameters involved. We found striking differences in the depletion rates between CD4 T cells to two common opportunistic pathogens, cytomegalovirus (CMV) and Mycobacterium tuberculosis (MTB). CMV-specific CD4 T cells persisted after HIV infection, whereas MTB-specific CD4 T cells were depleted rapidly. CMV-specific CD4 T cells expressed a mature phenotype and produced very little IL-2, but large amounts of MIP-1β. In contrast, MTB-specific CD4 T cells were less mature, and most produced IL-2 but not MIP-1β. Staphylococcal enterotoxin B-stimulated IL-2-producing cells were more susceptible to HIV infection in vitro than MIP-1β-producing cells. Moreover, IL-2 production was associated with expression of CD25, and neutralization of IL-2 completely abrogated productive HIV infection in vitro. HIV DNA was found to be most abundant in IL-2-producing cells, and least abundant in MIP-1β-producing MTB-specific CD4 T cells from HIV-infected subjects with active tuberculosis. These data support the hypothesis that differences in function affect the susceptibility of pathogen-specific CD4 T cells to HIV infection and depletion in vivo, providing a potential mechanism to explain the rapid loss of MTB-specific CD4 T cells after HIV infection.
Figures


Similar articles
-
Maturation and Mip-1β Production of Cytomegalovirus-Specific T Cell Responses in Tanzanian Children, Adolescents and Adults: Impact by HIV and Mycobacterium tuberculosis Co-Infections.PLoS One. 2015 May 14;10(5):e0126716. doi: 10.1371/journal.pone.0126716. eCollection 2015. PLoS One. 2015. PMID: 25974183 Free PMC article.
-
Restoration of CD4+ Responses to Copathogens in HIV-Infected Individuals on Antiretroviral Therapy Is Dependent on T Cell Memory Phenotype.J Immunol. 2015 Sep 1;195(5):2273-2281. doi: 10.4049/jimmunol.1500803. Epub 2015 Jul 20. J Immunol. 2015. PMID: 26195814 Free PMC article.
-
HIV-1 Infection Is Associated with Depletion and Functional Impairment of Mycobacterium tuberculosis-Specific CD4 T Cells in Individuals with Latent Tuberculosis Infection.J Immunol. 2017 Sep 15;199(6):2069-2080. doi: 10.4049/jimmunol.1700558. Epub 2017 Jul 31. J Immunol. 2017. PMID: 28760884 Free PMC article.
-
Interaction between HIV and Mycobacterium tuberculosis: HIV-1-induced CD4 T-cell depletion and the development of active tuberculosis.Curr Opin HIV AIDS. 2012 May;7(3):268-75. doi: 10.1097/COH.0b013e3283524e32. Curr Opin HIV AIDS. 2012. PMID: 22495739 Review.
-
The Immune Response to Mycobacterium tuberculosis in HIV-1-Coinfected Persons.Annu Rev Immunol. 2018 Apr 26;36:603-638. doi: 10.1146/annurev-immunol-042617-053420. Epub 2018 Feb 28. Annu Rev Immunol. 2018. PMID: 29490165 Review.
Cited by
-
HIV-Associated TB Syndemic: A Growing Clinical Challenge Worldwide.Front Public Health. 2015 Dec 23;3:281. doi: 10.3389/fpubh.2015.00281. eCollection 2015. Front Public Health. 2015. PMID: 26779470 Free PMC article. Review.
-
Survival of people living with HIV who defaulted from tuberculosis treatment in a cohort, Recife, Brazil.BMC Infect Dis. 2017 Feb 10;17(1):137. doi: 10.1186/s12879-016-2127-5. BMC Infect Dis. 2017. PMID: 28187753 Free PMC article.
-
Impact of antigen specificity on CD4+ T cell activation in chronic HIV-1 infection.BMC Infect Dis. 2013 Feb 25;13:100. doi: 10.1186/1471-2334-13-100. BMC Infect Dis. 2013. PMID: 23442890 Free PMC article.
-
HIV-1 infection of human intestinal lamina propria CD4+ T cells in vitro is enhanced by exposure to commensal Escherichia coli.J Immunol. 2012 Jul 15;189(2):885-96. doi: 10.4049/jimmunol.1200681. Epub 2012 Jun 11. J Immunol. 2012. PMID: 22689879 Free PMC article.
-
Spontaneous Control of SIV Replication Does Not Prevent T Cell Dysregulation and Bacterial Dissemination in Animals Co-Infected with M. tuberculosis.Microbiol Spectr. 2022 Jun 29;10(3):e0172421. doi: 10.1128/spectrum.01724-21. Epub 2022 Apr 25. Microbiol Spectr. 2022. PMID: 35467372 Free PMC article.
References
-
- Betts M.R., Nason M.C., West S.M., De Rosa S.C., Migueles S.A., Abraham J., Lederman M.M., Benito J.M., Goepfert P.A., Connors M., et al. 2006. HIV nonprogressors preferentially maintain highly functional HIV-specific CD8+ T cells. Blood. 107:4781–4789 10.1182/blood-2005-12-4818 - DOI - PMC - PubMed
-
- Biancotto A., Iglehart S.J., Vanpouille C., Condack C.E., Lisco A., Ruecker E., Hirsch I., Margolis L.B., Grivel J.C. 2008. HIV-1 induced activation of CD4+ T cells creates new targets for HIV-1 infection in human lymphoid tissue ex vivo. Blood. 111:699–704 10.1182/blood-2007-05-088435 - DOI - PMC - PubMed
-
- Blatt S.P., Hendrix C.W., Butzin C.A., Freeman T.M., Ward W.W., Hensley R.E., Melcher G.P., Donovan D.J., Boswell R.N. 1993. Delayed-type hypersensitivity skin testing predicts progression to AIDS in HIV-infected patients. Ann. Intern. Med. 119:177–184 - PubMed
-
- Brenchley J.M., Karandikar N.J., Betts M.R., Ambrozak D.R., Hill B.J., Crotty L.E., Casazza J.P., Kuruppu J., Migueles S.A., Connors M., et al. 2003. Expression of CD57 defines replicative senescence and antigen-induced apoptotic death of CD8+ T cells. Blood. 101:2711–2720 10.1182/blood-2002-07-2103 - DOI - PubMed
-
- Brenchley J.M., Hill B.J., Ambrozak D.R., Price D.A., Guenaga F.J., Casazza J.P., Kuruppu J., Yazdani J., Migueles S.A., Connors M., et al. 2004. T-cell subsets that harbor human immunodeficiency virus (HIV) in vivo: implications for HIV pathogenesis. J. Virol. 78:1160–1168 10.1128/JVI.78.3.1160-1168.2004 - DOI - PMC - PubMed
Publication types
MeSH terms
Substances
LinkOut - more resources
Full Text Sources
Other Literature Sources
Medical
Research Materials

