. 2010 Nov 2:4:196.
doi: 10.3389/fnhum.2010.00196. eCollection 2010.

Mechanisms for Phase Shifting in Cortical Networks and their Role in Communication through Coherence

Affiliations

Mechanisms for Phase Shifting in Cortical Networks and their Role in Communication through Coherence

Paul H Tiesinga et al. Front Hum Neurosci. .

Abstract

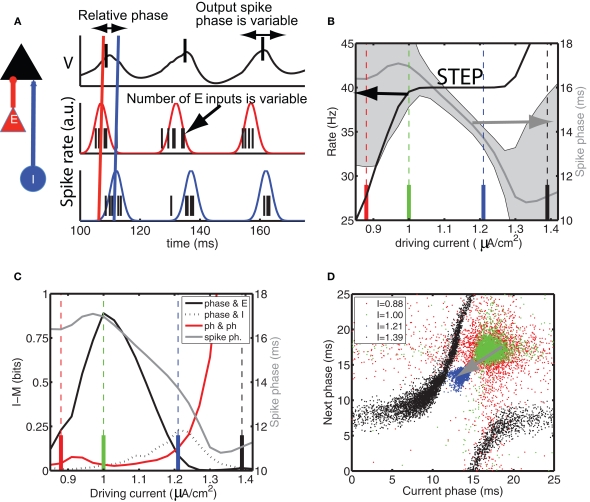
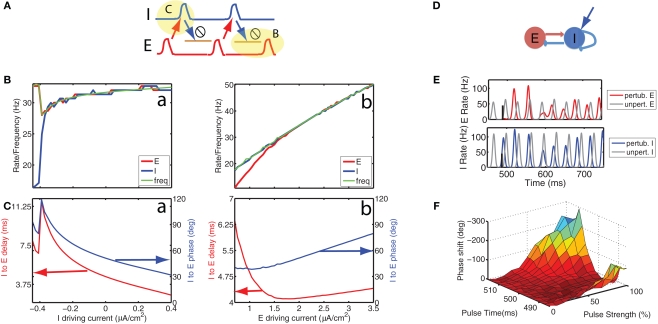
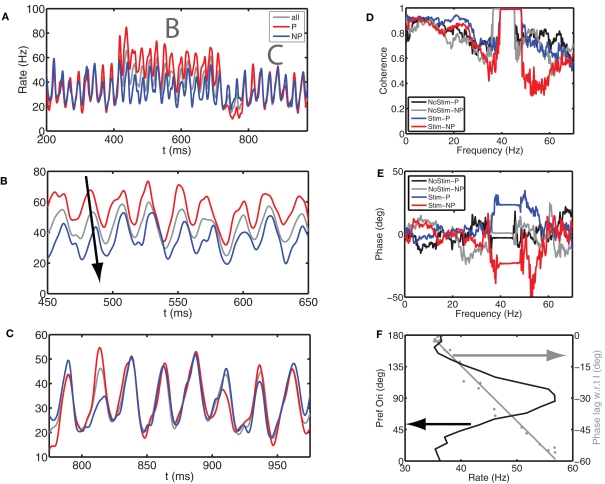
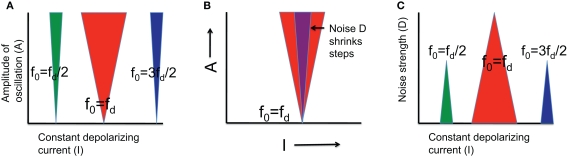
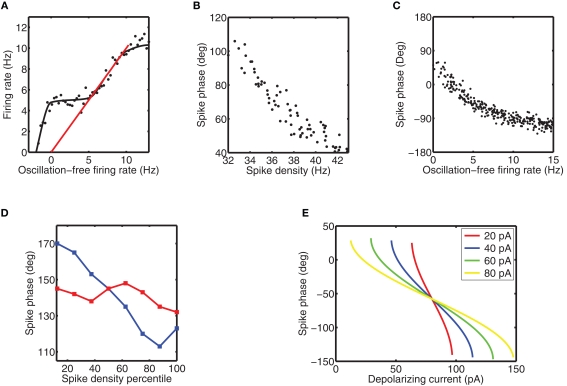
In the primate visual cortex, the phase of spikes relative to oscillations in the local field potential (LFP) in the gamma frequency range (30-80 Hz) can be shifted by stimulus features such as orientation and thus the phase may carry information about stimulus identity. According to the principle of communication through coherence (CTC), the relative LFP phase between the LFPs in the sending and receiving circuits affects the effectiveness of the transmission. CTC predicts that phase shifting can be used for stimulus selection. We review and investigate phase shifting in models of periodically driven single neurons and compare it with phase shifting in models of cortical networks. In a single neuron, as the driving current is increased, the spike phase varies systematically while the firing rate remains constant. In a network model of reciprocally connected excitatory (E) and inhibitory (I) cells phase shifting occurs in response to both injection of constant depolarizing currents and to brief pulses to I cells. These simple models provide an account for phase-shifting observed experimentally and suggest a mechanism for implementing CTC. We discuss how this hypothesis can be tested experimentally using optogenetic techniques.

Keywords: attention; gamma oscillations; phase locking; phase shifting; synchrony.


Figures

Figure 1
Figure 1
Communication through coherence (CTC) requires synchronous inhibition and excitation. (A) A possible mechanism for CTC (Fries, ; Tiesinga and Sejnowski, 2009). We consider three local circuits each comprised of a network of excitatory (E) and inhibitory (I) cells, with at least an inhibitory projection from the I to E cells. Two are in primary visual cortex (V1) and send an excitatory projection to the third one located in V4. The receptive field of each circuit is indicated by the gray squares that contain the schematic stimuli to which the V1 circuits respond: a rectangle for the left circuit and a circle for the right circuit. The V4 circuit responds to both stimuli. The yellow halo indicates that locus of spatial attention is at the circle stimulus. We explore how CTC can make the response of the circle preferring circuit in V1 become more effective in driving the neurons in the V4 circuit. The E cells in V4 receive local synchronized inhibition and two streams of synchronized E volleys. The following panels show that only the E stream arriving before inhibition can be effective in driving the neurons in V4. (B) When volleys of synchronized E activity arrive shortly after or at the same time as the I volley, the postsynaptic neuron does not spike, whereas (C) when the inhibition is delayed with respect to excitation the neuron does spike. We show (blue) I and (red) E conductance waveform (in arbitrary units, with the latter multiplied by a factor of five to illustrate the timing relationship more clearly) and (black) the membrane potential of the postsynaptic neuron receiving those synchronous synaptic drives. (D) The gating behavior is more clearly exposed by plotting the mean firing rate versus the delay between the E volley and I volley, here referred to as the relative phase. The firing rate is close to 0 when the E volley arrives just after the I volley and it is maximal when the E volley arrives just before. We show four different combinations of excitatory (σexc) and inhibitory precisions (σinh) expressed in terms of the standard deviation of spike times in the volley with units of ms: (σexc, σinh) is (black curve) (1,1), (red curve) (5,1), (blue curve) (1,5), and (green curve) (5,5). These curves show that relative phase operates most effectively as a gate when both inhibition and excitation are precisely synchronized. (E) Relative phase can gain modulate the input-to-output relationship of the neuron. We show the firing rate as a function of the rate with which E inputs arrive at the neuron for relative phases equal to (black curve) 20 ms, (red curve) 12 ms, (blue curve) 8 ms, and (green curve) 6 ms. (A) was adapted from Tiesinga, P., and Sejnowski, T. J. (2009). Cortical enlightenment: are attentional gamma oscillations driven by ING or PING? Neuron 63, 727–732 with permission.
Figure 2
Figure 2
The information content of the spike times depends on the mean spike phase. (A) Diagram of model setup, the model neuron (black) is driven by synchronous, periodic excitatory inputs (red) that precede the synchronous, periodic inhibitory inputs (blue). We sketch the (black) membrane potential oscillations in response to (red) E and (blue) I periodic Gaussian spike densities, which are drawn together with spike times drawn from them. The output spike phase (black ticks in top panel) relative to the oscillation is variable because the number of E inputs varies from cycle to cycle. The mutual information is used to quantify the information in the spike phase about the number of E inputs in the volley that generated the spike. (B) The neuron phase-locks in the range of driving currents between approximately 1.0 and 1.3 (expressed in μA/cm2) because (black line, left hand-side axis) its firing rate is constant and equal to the oscillation frequency of the E and I inputs. During phase locking, the standard deviation in the spike phase – indicated by the half height of gray shading – becomes minimal and (gray curve, right hand-side axis) the mean spike phase is a function of driving current. Specifically, for higher current values the spikes appeared earlier in the cycle. (C), black curve, left hand-side axis) The mutual information IM, between the number of E inputs on a given cycle and the resulting spike phase, attained its maximum at the low current value of the step and decreased when the driving current was increased. In contrast (dashed black curve), the mutual information between the number of I inputs and spike phase and (red curve) mutual information between consecutivespikes phases increased with driving current. For comparison, the mean phase is re-plotted from (B) as the gray curve. The colored vertical lines indicate the current values for which the return map is shown in (D). (D) The spike phase varies from cycle to cycle because of the variation in the number of E and I inputs on a cycle and the state of the neuron, the latter of which is partially reflected in the value of the previous spike phase. The return map shows the correlation between consecutive phases. The color of the dots corresponds to the current value indicated by the colored vertical lines in (B,C).
Figure 3
Figure 3
Stimulation of interneurons can alter internal phase as well as the global phase, thereby providing a means of manipulating information transmission according to the communication through coherence principle. (A) In the PING architecture, an excitatory (E) volley recruits an inhibitory (I) volley at a delay which depends on the level of depolarization of the I cells, whereas the E cells recover from inhibition with a time scale that depends on the time constant of inhibition and the level of depolarization. This predicts that increasing depolarization of the I cells will mostly reduce the I to E latency and will not strongly affect the oscillation frequency. Hence, a constant depolarizing current changes the relative phase between I and E. (B, green) Oscillation frequency, (red) E cell, and (blue) I cell firing rate as a function of the depolarizing current injected into the (a) I and (b) E cells. Because the curves are overlapping for higher current values, the green curve occludes the red and blue curves, thereby making them less visible. (C, red) delay between I and E volleys produced by the network and (blue) the corresponding relative phase as a function of the depolarizing current injected into the (a) I and (b) E cells. (D) Short excitatory pulses, such as those generated by optically stimulating channel rhodopsin-2 channels, can shift the global phase of a local circuit. We consider a network with reciprocal connections between E and I cells as well as mutual inhibition between I cells, which are also stimulated optically. (E, top) E-cell spike time histogram for (gray) the unperturbed network and (red) the network perturbed by a pulse to the I cells. (E, bottom) I-cell spike time histogram for (gray) the unperturbed network and (blue) the network perturbed by a pulse to the I cells. Because the pulse arrived before the I cell volley in the unperturbed case, it induced a weaker but earlier I cell volley, which resulted in a larger and later E cell volley. The effect of this was a forward shift (negative phase) that persisted in the stationary state of the oscillation to which the network returned in a few cycles. (F) We determined the phase shift as a function of pulse strength and pulse time (with reference to the unperturbed inhibitory volley, which was at approximately 500 ms). The most effective modulation was obtained when the pulse arrived about 10 ms after the I cell volley. In that case the shift increased (i.e., became more negative) with increasing pulse strength. The scale was inverted with negative phases plotted in the positive z direction. A was adapted from Tiesinga, P., and Sejnowski, T. J. (2009). Cortical enlightenment: are attentional gamma oscillations driven by ING or PING? Neuron 63, 727–732 with permission.
Figure 4
Figure 4
Gamma phase shifting emerges in a hypercolumn model of the visual cortex. We simulated a hypercolumn model where orientation selectivity was generated by a thalamocortical projection (Hubel and Wiesel, 1968) and where this selectivity was strengthened by recurrent circuitry (Somers et al., 1995). The firing rate of the E cells depended on the difference between their preferred orientation and the stimulus orientation. Parameters are as for Figure 21.10B in Tiesinga and Buia (2007). (A) We show the spike time histograms for (gray, “All”) all the E cells, (red, P population) five columns with preferred orientations closest and (blue, NP population) five columns with preferred orientations farthest from the stimulus orientation. The stimulus was present between 400 and 700 ms. (B,C) Close up of (A) during (B) the stimulus period and (C) after the stimulus. The arrow shows that E cells whose preferred orientation matches that of the stimulus fire ahead of the overall population and the E cells that prefer an orthogonal stimulus lag the population. After the stimulus both groups fire at the same time as the population. (D) The coherence between the overall E cell population and P and NP groups has a clear peak at gamma frequencies, which shifts to higher frequencies during stimulus presentation as compared to when there is no stimulus. We show (red) All-P coherence and (blue) All-NP coherence during the stimulus, whereas All-P and All-NP coherence after the stimulus is shown in black and gray, respectively. (E) The relative phase between entire E cell population and P and NP population with the same color code as for (D). During the stimulus period, the Ps have a negative phase indicating they are ahead of the population, whereas the NPs have a positive phase, indicating they are lagging the overall population. (F, black curve) The E-cell firing rate in a column as a function of its preferred orientation has a bell shaped curve. Furthermore (gray curve), the spike phase relative to the peak in I cell activity varied with mean firing rate and hence was a function of the preferred orientation. The cells with the highest firing rate fired approximately 60° before the I cells did, whereas those with the lowest firing rate fired just before the I cells.
Figure 5
Figure 5
Schematic diagram of Arnold tongues. (A) Phase-locked solutions are labeled p:q, which means that the neuron produces p spikes on q cycles. We illustrate (green) the 1:2 step for which f0= (1/2)fd; (red) the 1:1 step for which f0= fd; and (blue) the 3:2 step for which f0= (3/2)fd. The steps have 0 width (in the current I direction) when the amplitude A of the sinusoidal current is 0, but expand when A is increased, with the 1:1 step, the fundamental, being the broadest. (B) Noise (strength is indicated by D) destroys the phase-locked solutions at the edges, thereby reducing the width of the phase-locking steps. (C) The effect of noise is better illustrated by fixing the amplitude A and varying the noise strength D. Phase-locking steps shrink as D increases until they finally disappear. The 1:1 step is the most stable because it persists even when the other steps have already disappeared. The detailed description of these results can be found in Tiesinga (2002) for the case where fd is varied rather than f0 via I.
Figure 6
Figure 6
Phase-shifting is observed in vitro and in vivo. (A) The firing rate in response to a tonic depolarizing current and a 5 Hz sinusoidal current versus the firing rate without the sinusoidal current. The firing rate was systematically varied by increasing the strength of the tonic current. The step is visible as the location where the firing rate on the y axis is constant, whereas that on the x axis changes. The dots are typical data points, whereas the solid line is the smooth curve that follows these points. The red line represents y = x. For the data points on this line, the addition of oscillatory current does not alter the firing rate. This graph is a schematic representation of the data shown in Figure 1C of McLelland and Paulsen (2009). (B) Phase-shifting of neurons in the primary visual cortex of the macaque. For these data the phase is taken relative to the LFP and is plotted against the spike density calculated by convolving the spike train with a Gaussian of a standard deviation of 50 ms. The graph is a schematic representation of Figure 4C of Vinck et al. (2010). (C) The spike phase relative to the sinusoidal current versus the oscillation-free firing rate for the data shown in (A). This graph is a schematic representation of the data shown in Figure 1F of McLelland and Paulsen (2009). (D) The range across which can be phase-shifted in vivo does depend on the degree of phase locking. The red curve is for strong phase-locking and the blue curve is for weak phase-locking. This graph schematically represents the data shown in Figure 6D of Vinck et al. (2010). (E) Phase-shifting can be studied analytically by determining the spike phase as a function of the level and depolarizing current for the leaky integrate-and-fire neuron for different amplitudes of the sinusoidal current (each indicated by a different line color according to the legend shown as inset). Because the precision of a neuron is proportional to the time derivative of the membrane potential at spike threshold (Cecchi et al., 2000), a higher amplitude of the sinusoidal current will improve precision and hence the phase-locking strength. The noise-less analytical results shown here predict that the range across which the phase can be shifted is not altered by amplitude. This graph is based on Figure 4A of McLelland and Paulsen (2009) (we show the case where the spike threshold exceeds the reset potential by 20 mV).

Similar articles

Cited by

References

    1. Ardid S., Wang X. J., Gomez-Cabrero D., Compte A. (2010). Reconciling coherent oscillation with modulation of irregular spiking activity in selective attention: gamma-range synchronization between sensory and executive cortical areas. J. Neurosci. 30, 2856–287010.1523/JNEUROSCI.4222-09.2010 - DOI - PMC - PubMed
    1. Ben-Yishai R., Bar-Or R. L., Sompolinsky H. (1995). Theory of orientation tuning in visual cortex. Proc. Natl. Acad. Sci. U.S.A. 92, 3844–384810.1073/pnas.92.9.3844 - DOI - PMC - PubMed
    1. Bernander O., Koch C., Usher M. (1994). The effect of synchronized inputs at the single neuron level. Neural Comput. 6, 622–64110.1162/neco.1994.6.4.622 - DOI
    1. Bichot N. P., Rossi A. F., Desimone R. (2005). Parallel and serial neural mechanisms for visual search in macaque area V4. Science 308, 529–53410.1126/science.1109676 - DOI - PubMed
    1. Borgers C., Epstein S., Kopell N. J. (2005). Background gamma rhythmicity and attention in cortical local circuits: A computational study. Proc. Natl. Acad. Sci. U.S.A. 102, 7002–700710.1073/pnas.0502366102 - DOI - PMC - PubMed

LinkOut - more resources