

Principles of early drug discovery
- PMID: 21091654
- PMCID: PMC3058157
- DOI: 10.1111/j.1476-5381.2010.01127.x
Principles of early drug discovery
Abstract
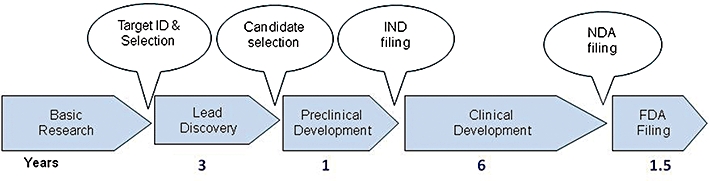
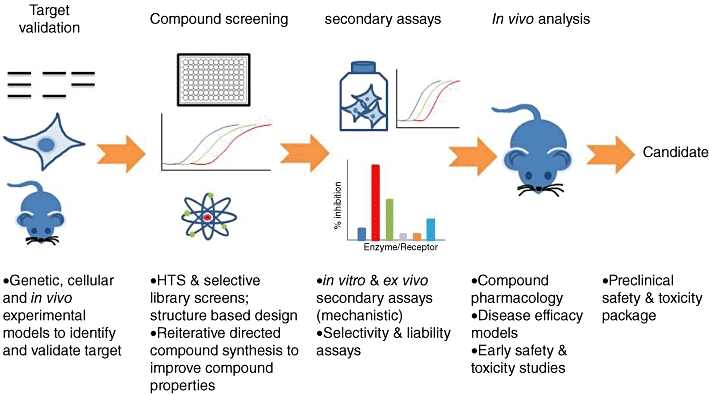
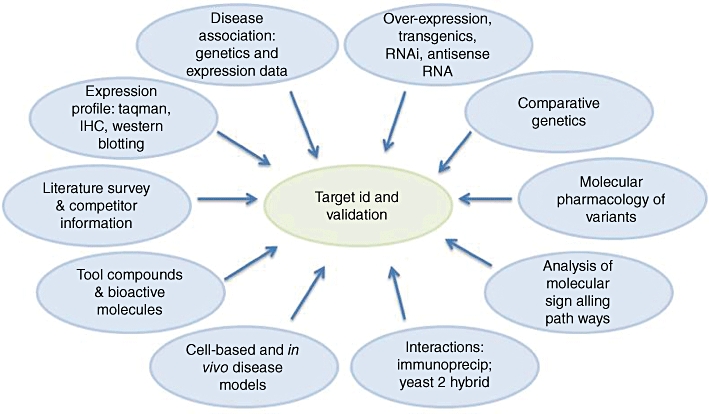
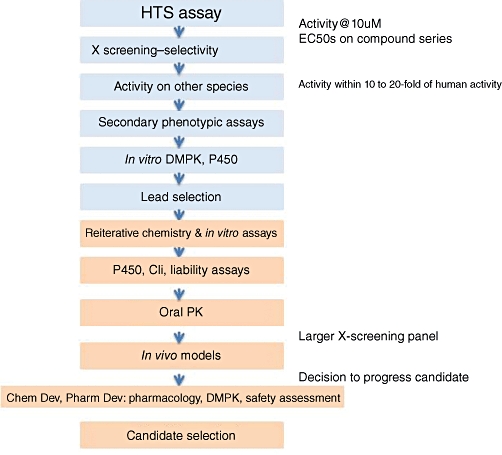
Developing a new drug from original idea to the launch of a finished product is a complex process which can take 12-15 years and cost in excess of $1 billion. The idea for a target can come from a variety of sources including academic and clinical research and from the commercial sector. It may take many years to build up a body of supporting evidence before selecting a target for a costly drug discovery programme. Once a target has been chosen, the pharmaceutical industry and more recently some academic centres have streamlined a number of early processes to identify molecules which possess suitable characteristics to make acceptable drugs. This review will look at key preclinical stages of the drug discovery process, from initial target identification and validation, through assay development, high throughput screening, hit identification, lead optimization and finally the selection of a candidate molecule for clinical development.
© 2011 The Authors. British Journal of Pharmacology © 2011 The British Pharmacological Society.
Figures
Similar articles
-
Open access high throughput drug discovery in the public domain: a Mount Everest in the making.Curr Pharm Biotechnol. 2010 Nov;11(7):764-78. doi: 10.2174/138920110792927757. Curr Pharm Biotechnol. 2010. PMID: 20809896 Free PMC article. Review.
-
In silico pharmacology for a multidisciplinary drug discovery process.Drug Metabol Drug Interact. 2012;27(4):199-207. doi: 10.1515/dmdi-2012-0021. Drug Metabol Drug Interact. 2012. PMID: 23152402 Review.
-
Fragment screening to predict druggability (ligandability) and lead discovery success.Drug Discov Today. 2011 Apr;16(7-8):284-7. doi: 10.1016/j.drudis.2011.02.002. Epub 2011 Feb 16. Drug Discov Today. 2011. PMID: 21315179 Review. No abstract available.
-
Integration of small-molecule discovery in academic biomedical research.Mt Sinai J Med. 2010 Jul-Aug;77(4):350-7. doi: 10.1002/msj.20197. Mt Sinai J Med. 2010. PMID: 20687180 Free PMC article. Review.
-
Affinity-based screening techniques: their impact and benefit to increase the number of high quality leads.Expert Opin Drug Discov. 2010 Nov;5(11):1095-107. doi: 10.1517/17460441.2010.524641. Epub 2010 Oct 7. Expert Opin Drug Discov. 2010. PMID: 22827747 Review.
Cited by
-
GDF15 Targeting for Treatment of Hyperemesis Gravidarum.Medicines (Basel). 2024 Aug 30;11(7):17. doi: 10.3390/medicines11070017. Medicines (Basel). 2024. PMID: 39311313 Free PMC article.
-
A larval zebrafish model of cardiac physiological recovery following cardiac arrest and myocardial hypoxic damage.Biol Open. 2024 Sep 15;13(9):bio060230. doi: 10.1242/bio.060230. Epub 2024 Sep 12. Biol Open. 2024. PMID: 39263862 Free PMC article.
-
Navigating the Frontiers of Machine Learning in Neurodegenerative Disease Therapeutics.Pharmaceuticals (Basel). 2024 Jan 25;17(2):158. doi: 10.3390/ph17020158. Pharmaceuticals (Basel). 2024. PMID: 38399373 Free PMC article. Review.
-
Non-clinical studies required for new drug development - Part I: early in silico and in vitro studies, new target discovery and validation, proof of principles and robustness of animal studies.Braz J Med Biol Res. 2016 Oct 24;49(11):e5644. doi: 10.1590/1414-431X20165644. Braz J Med Biol Res. 2016. PMID: 27783811 Free PMC article. Review.
-
Brief Guide: Experimental Strategies for High-Quality Hit Selection from Small-Molecule Screening Campaigns.SLAS Discov. 2021 Aug;26(7):851-854. doi: 10.1177/24725552211008862. Epub 2021 Apr 21. SLAS Discov. 2021. PMID: 33882754 Free PMC article.
References
-
- Bertram L, Tanzi RE. Thirty years of Alzheimer's disease genetics: the implications of systematic meta-analyses. Nat Rev Neurosci. 2008;9:768–778. - PubMed
-
- Boppana K, Dubey PK, Jagarlapudi SARP, Vadivelan S, Rambabu G. Knowledge based identification of MAO-B selective inhibitors using pharmacophore and structure based virtual screening models. Eur J Med Chem. 2009;44:3584–3590. - PubMed
-
- Chessell IP, Hatcher JP, Bountra C, Michel AD, Hughes JP, Green P, et al. Disruption of the P2X7 purinoceptor gene abolishes chronic inflammatory and neuropathic pain. Pain. 2005;114:386–396. - PubMed
Publication types
MeSH terms
Grants and funding
LinkOut - more resources
Full Text Sources
Other Literature Sources
