Lymphomas differ in their dependence on Epstein-Barr virus
- PMID: 21088132
- PMCID: PMC3056644
- DOI: 10.1182/blood-2010-05-285791
Lymphomas differ in their dependence on Epstein-Barr virus
Abstract
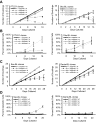
Epstein-Barr virus (EBV) encodes oncogenic information and, oftentimes concomitant with host immunosuppression, gives rise to malignancies in all major categories of lymphoma defined by the World Health Organization. Here, we conditionally evicted the viral extrachromosomal genome from tumor cells in vitro to examine the role of EBV in different lymphomas, including Burkitt lymphoma (BL) and posttransplant lymphoproliferative disorder. Cells derived from 2 canonical BLs were found to have the least dependence on the virus; some required EBV to prevent the inefficient induction of apoptosis. In contrast, cells derived from a subset of BL, Wp-restricted BL, required EBV to block a robust apoptotic program that involves the up-regulation of the proapoptotic protein Bim. Wp-restricted BL cells also relied on the virus to promote efficient proliferation, a distinction that highlights the multiple contributions EBV makes to affect proliferation of its host cells. Like Wp-BL cells, posttransplant lymphoproliferative disorder cells depended on the virus to inhibit apoptosis. They furthermore required the virus to drive them out of G(1)/G(0). Together, these results reveal a graded dependence on EBV among tumor cells that directly correlates with the number of viral genes expressed in the tumor cell.
Figures


Comment in
-
What keeps the power on in lymphomas?Blood. 2011 Feb 10;117(6):1777-8. doi: 10.1182/blood-2010-12-322222. Blood. 2011. PMID: 21310934 No abstract available.
Similar articles
-
Epstein-Barr virus-encoded Bcl-2 homologue functions as a survival factor in Wp-restricted Burkitt lymphoma cell line P3HR-1.J Virol. 2010 Mar;84(6):2893-901. doi: 10.1128/JVI.01616-09. Epub 2009 Dec 30. J Virol. 2010. PMID: 20042495 Free PMC article.
-
Epstein-Barr virus latent membrane protein-1 oncogene deletions: correlations with malignancy in Epstein-Barr virus--associated lymphoproliferative disorders and malignant lymphomas.Blood. 1996 Jul 1;88(1):242-51. Blood. 1996. PMID: 8704180
-
Latent Epstein-Barr virus infection collaborates with Myc over-expression in normal human B cells to induce Burkitt-like Lymphomas in mice.PLoS Pathog. 2024 Apr 15;20(4):e1012132. doi: 10.1371/journal.ppat.1012132. eCollection 2024 Apr. PLoS Pathog. 2024. PMID: 38620028 Free PMC article.
-
Insights into the evolution of lymphomas induced by Epstein-Barr virus.Adv Cancer Res. 2010;108:1-19. doi: 10.1016/B978-0-12-380888-2.00001-7. Adv Cancer Res. 2010. PMID: 21034964 Review.
-
How does Epstein-Barr virus (EBV) complement the activation of Myc in the pathogenesis of Burkitt's lymphoma?Semin Cancer Biol. 2009 Dec;19(6):366-76. doi: 10.1016/j.semcancer.2009.07.007. Epub 2009 Jul 25. Semin Cancer Biol. 2009. PMID: 19635566 Free PMC article. Review.
Cited by
-
Four-dimensional analyses show that replication compartments are clonal factories in which Epstein-Barr viral DNA amplification is coordinated.Proc Natl Acad Sci U S A. 2019 Dec 3;116(49):24630-24638. doi: 10.1073/pnas.1913992116. Epub 2019 Nov 19. Proc Natl Acad Sci U S A. 2019. PMID: 31744871 Free PMC article.
-
Aggressive B-cell lymphomas: a review of new and old entities in the WHO classification.Hematology Am Soc Hematol Educ Program. 2011;2011:506-14. doi: 10.1182/asheducation-2011.1.506. Hematology Am Soc Hematol Educ Program. 2011. PMID: 22160082 Free PMC article. Review.
-
How human tumor viruses make use of autophagy.Cells. 2012 Aug 27;1(3):617-30. doi: 10.3390/cells1030617. Cells. 2012. PMID: 24710493 Free PMC article.
-
How Epstein-Barr Virus and Kaposi's Sarcoma-Associated Herpesvirus Are Maintained Together to Transform the Same B-Cell.Viruses. 2021 Jul 28;13(8):1478. doi: 10.3390/v13081478. Viruses. 2021. PMID: 34452344 Free PMC article.
-
How EBV Infects: The Tropism and Underlying Molecular Mechanism for Viral Infection.Viruses. 2022 Oct 27;14(11):2372. doi: 10.3390/v14112372. Viruses. 2022. PMID: 36366470 Free PMC article. Review.
References
-
- Kelly GL, Rickinson AB. Burkitt lymphoma: revisiting the pathogenesis of a virus-associated malignancy. Hematology Am Soc Hematol Educ Program. 2007:277–284. - PubMed
-
- Andreone P, Gramenzi A, Lorenzini S, et al. Posttransplantation lymphoproliferative disorders. Arch Intern Med. 2003;163(17):1997–2004. - PubMed
-
- Niedobitek G, Agathanggelou A, Rowe M, et al. Heterogeneous expression of Epstein-Barr virus latent proteins in endemic Burkitt's lymphoma. Blood. 1995;86(2):659–665. - PubMed
Publication types
MeSH terms
Substances
Grants and funding
LinkOut - more resources
Full Text Sources
Medical
Research Materials

