. 2011 Jan 14;405(2):607-18.
doi: 10.1016/j.jmb.2010.11.008. Epub 2010 Nov 10.

Alternate states of proteins revealed by detailed energy landscape mapping

Affiliations

Alternate states of proteins revealed by detailed energy landscape mapping

Michael D Tyka et al. J Mol Biol. .

Abstract

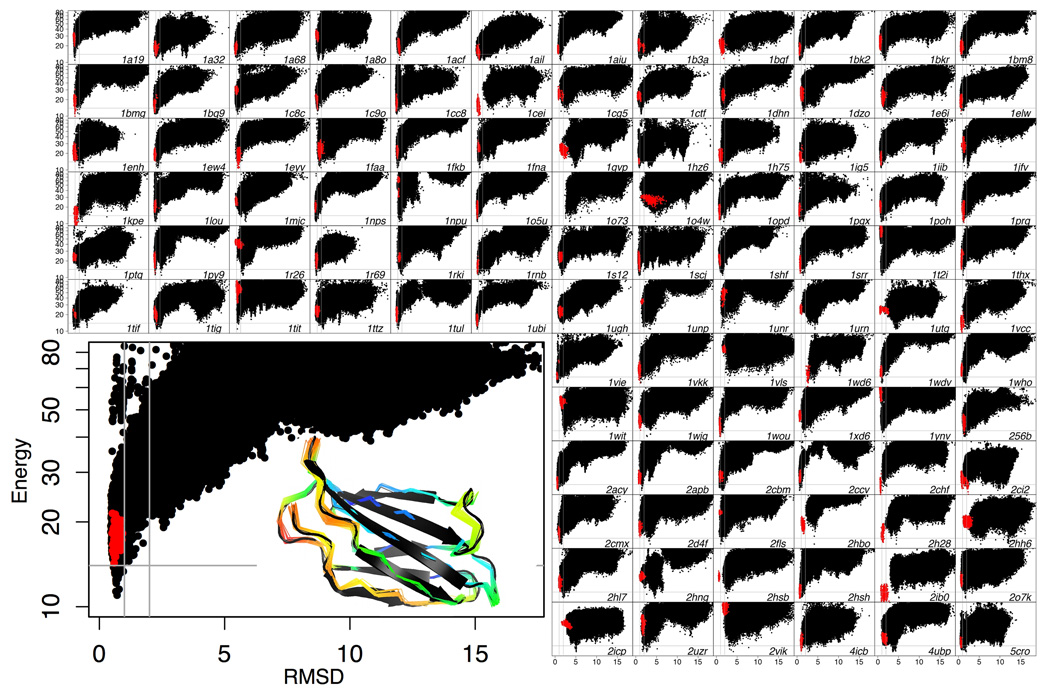
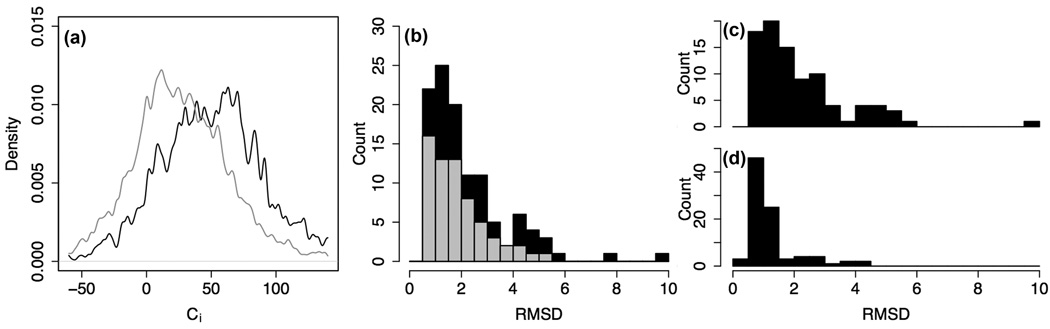
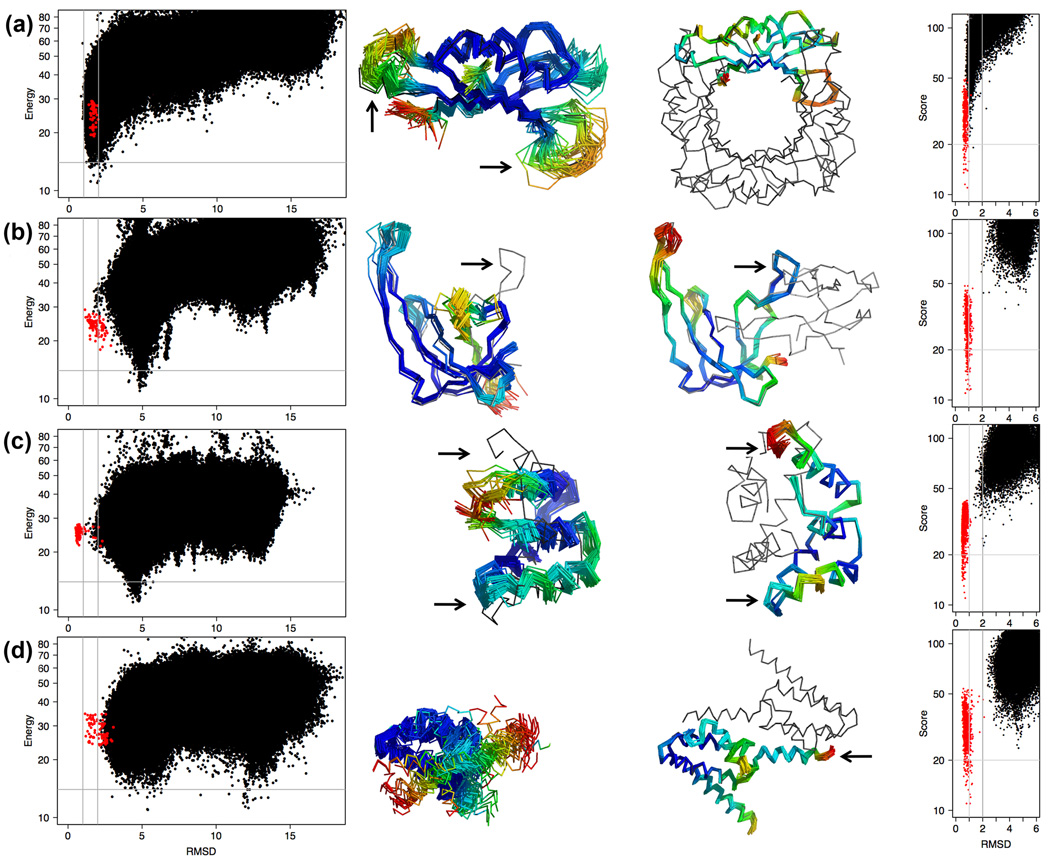
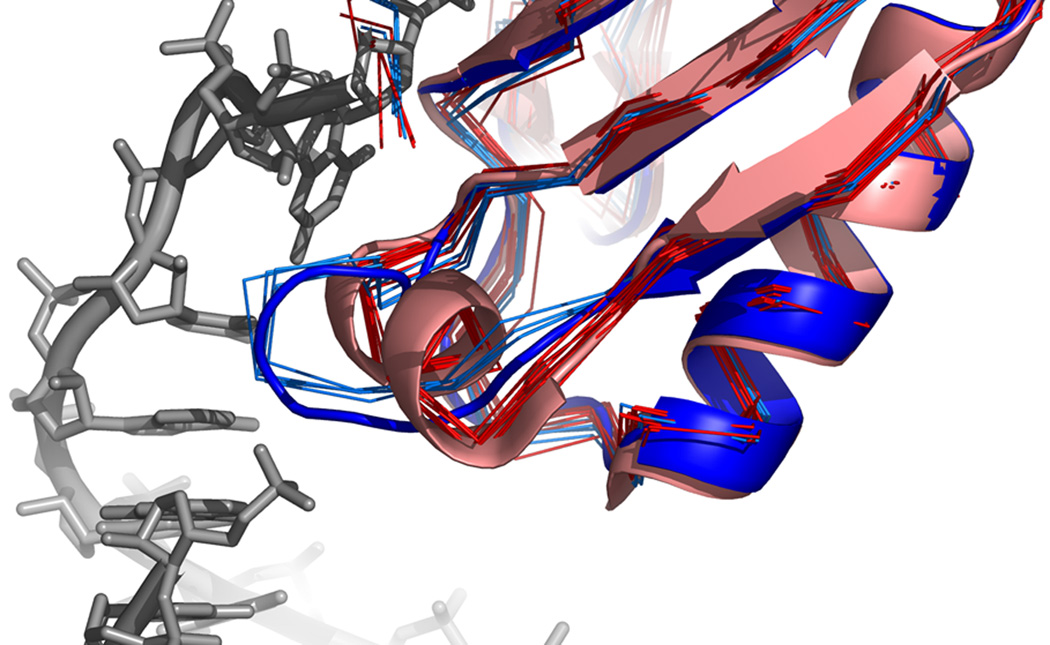
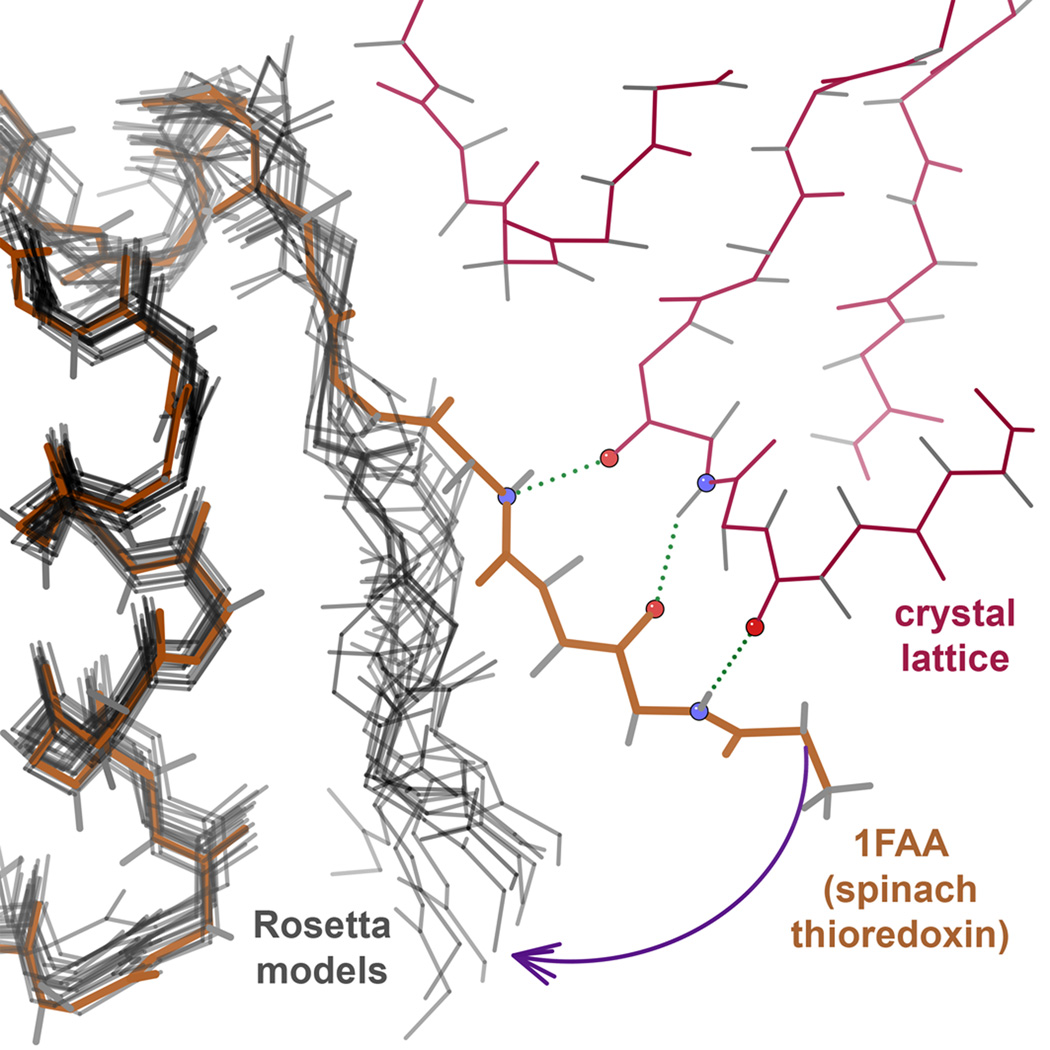
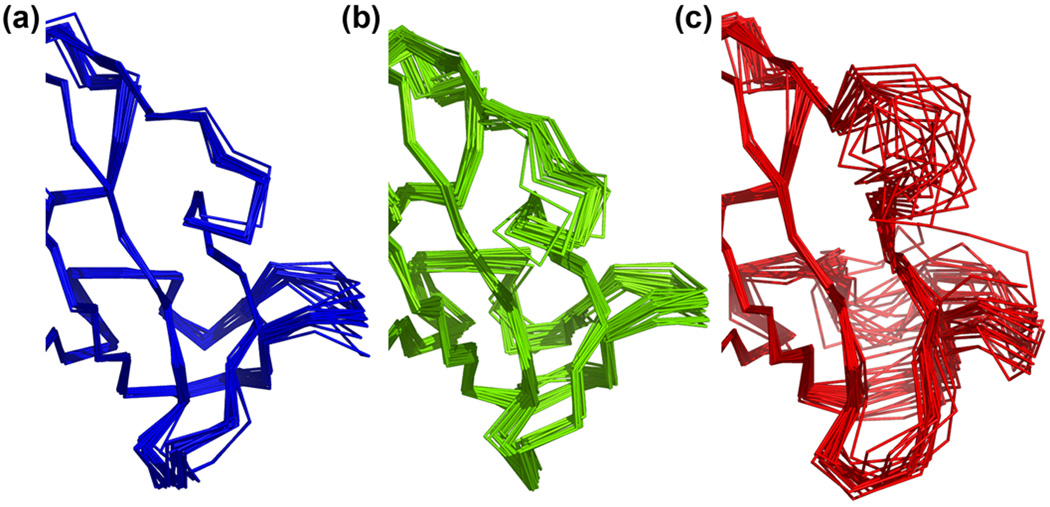
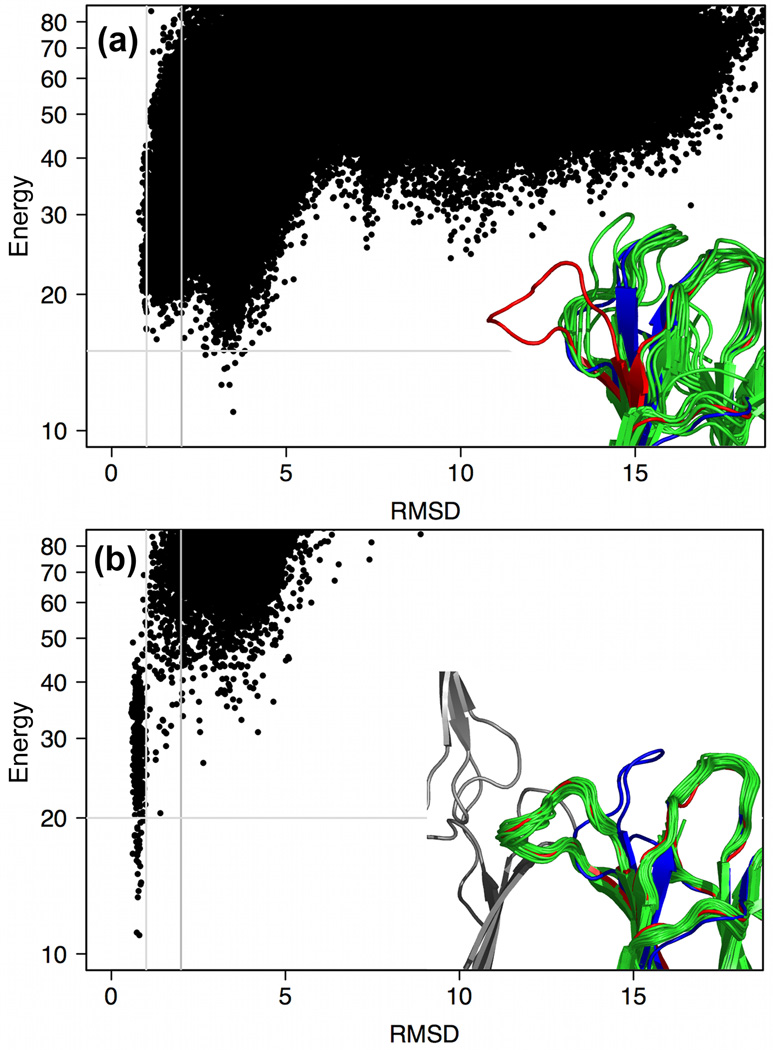
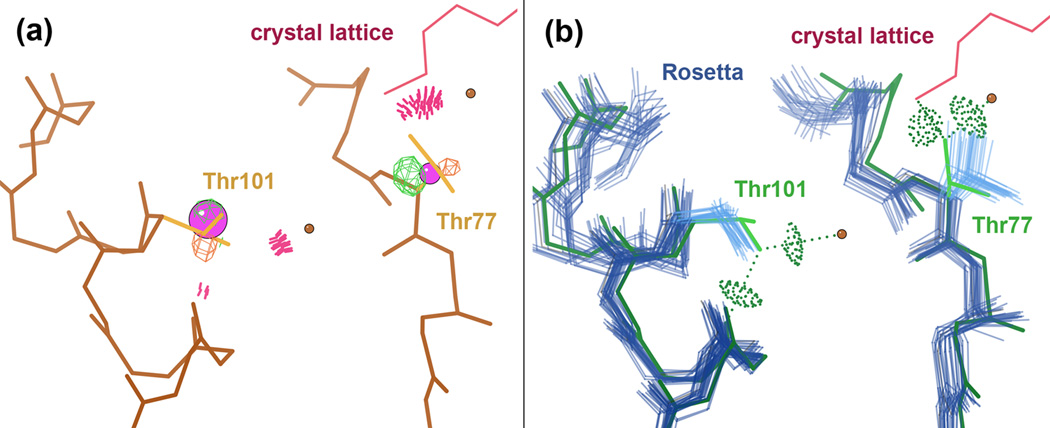
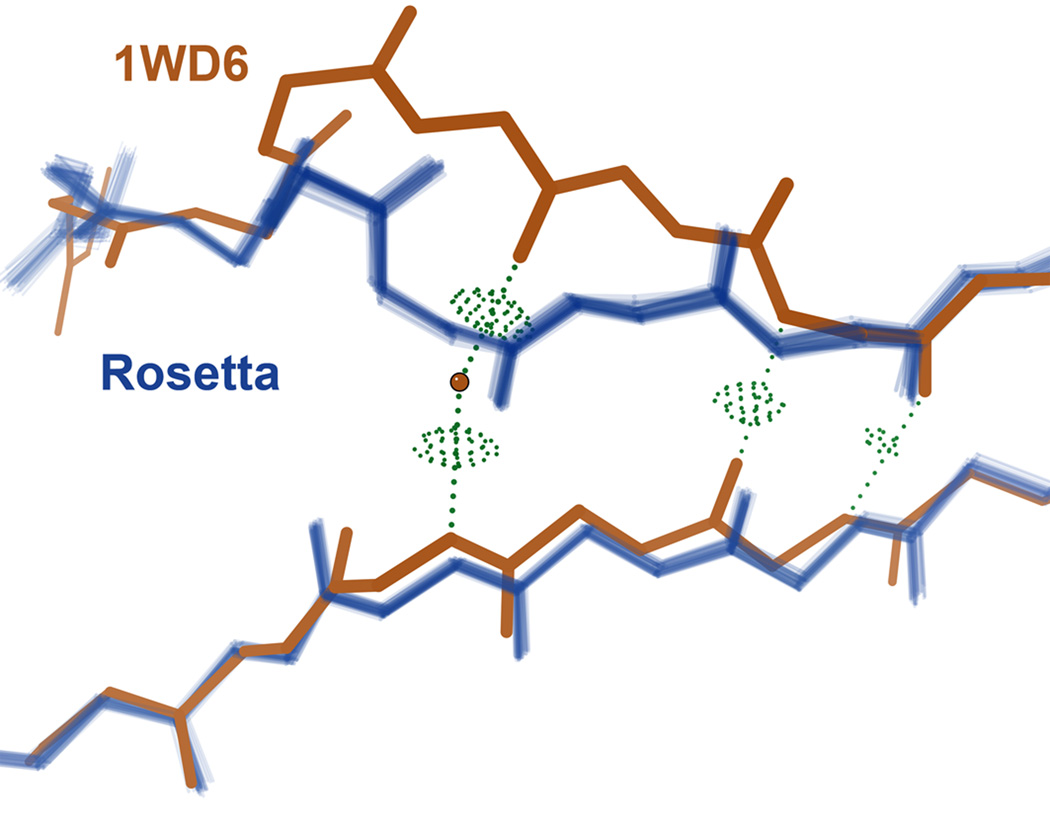
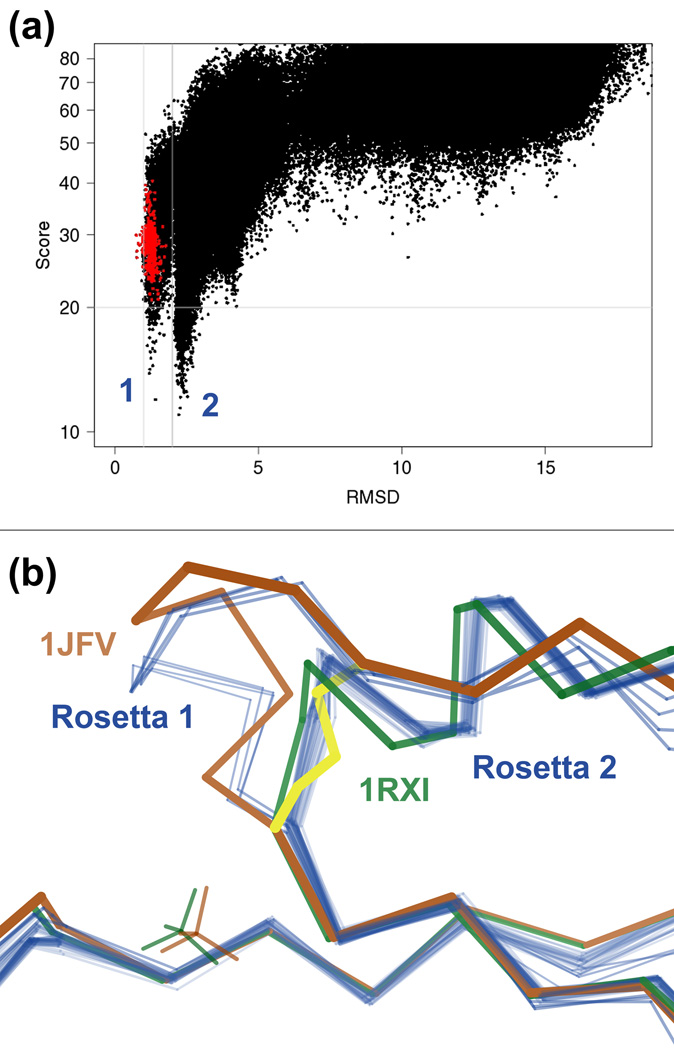
What conformations do protein molecules populate in solution? Crystallography provides a high-resolution description of protein structure in the crystal environment, while NMR describes structure in solution but using less data. NMR structures display more variability, but is this because crystal contacts are absent or because of fewer data constraints? Here we report unexpected insight into this issue obtained through analysis of detailed protein energy landscapes generated by large-scale, native-enhanced sampling of conformational space with Rosetta@home for 111 protein domains. In the absence of tightly associating binding partners or ligands, the lowest-energy Rosetta models were nearly all <2.5 Å C(α)RMSD from the experimental structure; this result demonstrates that structure prediction accuracy for globular proteins is limited mainly by the ability to sample close to the native structure. While the lowest-energy models are similar to deposited structures, they are not identical; the largest deviations are most often in regions involved in ligand, quaternary, or crystal contacts. For ligand binding proteins, the low energy models may resemble the apo structures, and for oligomeric proteins, the monomeric assembly intermediates. The deviations between the low energy models and crystal structures largely disappear when landscapes are computed in the context of the crystal lattice or multimer. The computed low-energy ensembles, with tight crystal-structure-like packing in the core, but more NMR-structure-like variability in loops, may in some cases resemble the native state ensembles of proteins better than individual crystal or NMR structures, and can suggest experimentally testable hypotheses relating alternative states and structural heterogeneity to function.


Figures

Fig. 1
Fig. 1
Computed energy landscapes. Each panel represents a different protein. The y-axis is the Rosetta all-atom energy and the x-axis the CαRMSD from the crystal structure; red dots are models relaxed from the crystal structure. The inset shows the energy landscape for 1TEN (a fibronectin type III domain) in more detail and a superposition of the models within 4 energy units of the lowest-energy model (indicated by the horizontal gray line in the plot) on the crystal structure (black). Colors indicate amount of variation in the Rosetta ensemble (blue, low; red, high); variation is concentrated towards the loops. The vertical gray bars indicate the 1Å and 2Å points. Note that the y-axis has been compressed at higher values to fit in the high-energy states without losing detail at the lower (more interesting) energies. For 41% of the proteins examined the lowest-energy structure is within 1.2Å CαRMSD from the deposited crystal structure (as for 1TEN), and for 70% it is within 2.5Å CαRMSD (see also Fig. 2b).
Fig. 2
Fig. 2
Origins of structural deviations. a) Histogram of contact number Ci for residues with Ca-Ca displacement from the crystal structure of more than 0.75Å (gray) and less than 0.75Å (black). The contact number is the number of intra-molecular interactions made by a residue minus the number of intermolecular contacts made by that residue in the crystal. A negative Ci indicates that the residue is stabilized primarily by crystal contacts or interactions with a ligand. Deviations in the calculated global minima are generally larger when the number of contacts across the crystal or oligomer interface exceeds the number of intramolecular contacts of a residue. However, note that in many cases the effects of missing crystal or quaternary contacts propagate quite far away from the actual site of contact, making it difficult to quantify this effect accurately. b) Histogram of the CaRMSD from the native structure of the lowest-energy structure for each protein simulated. Black bars: proteins with strongly interacting binding partners; gray: all others. 12 out of 16 proteins with deviations above 4Å CaRMSD are oligomeric in solution. c) and d) CaRMSD distributions for 90 proteins simulated in isolation and (c) in the crystal and/or oligomeric environment (d), where most large deviations disappear.
Fig. 3
Fig. 3
Energy landscapes of monomeric vs. oligomeric states of proteins. The left-hand side shows a landscape plot and lowest-energy ensemble for each isolated protein. The right-hand side shows the same proteins simulated in the crystal environment, including their oligomeric binding partners. Colors indicate amount of variation in the Rosetta ensemble (blue, low; red, high), highest at loops and ends. In all but the first case, the lowest-energy models deviate significantly from the deposited coordinates locally, near the oligomeric binding sites. a) 1DHN, dihydroneopterin aldolase. Two long loops (see arrows) show similar conformations but much more variability when the rest of the tetrameric ring is not simulated. b) 1GVP, gene V protein from Ff phage. In isolated simulations the hairpin at top right (see arrow) collapses onto the body of the protein, while in the dimer it makes extensive contacts across the interface. Note that another long, protruding hairpin does not collapse. c) 1UTG, uteroglobin. Pairs of interface helices (see arrows) spread apart to form the dimer, rather than the commoner movement of a single chain-terminal helix (as in part d). d) 2HH6, BH3980 from Bacillus halodurans. The C-terminal helix (see arrow) populates two separate and variable positions (the two red ends) in the monomer, one of which matches the experimentally observed position across the dimer interface.
Fig 4
Fig 4
Influence of binding partner. The simulation of 1URN identifies two pronounced minima in the main RNA binding loop 46–52. One (thin blue backbones) matches the conformation found in 1URN (thick blue backbone) contacting the RNA, while the other (thin red backbones) forms a short helix matching the unbound conformation found in 1NU4 chain A (thick red backbone), a crystal structure of the apo form of this protein. Rosetta ranks these two minima (in the absence of RNA) equal in energy, suggesting that both the bound and apo conformations could be sampled in solution. This is further supported by the fact that chain B in 1NU4 is in a conformation close to that of 1URN.
Fig. 5
Fig. 5
Effect of crystal packing interactions. In a crystal structure of a monomeric spinach thioredoxin (1FAA) (brown), the N-terminus engages in significant β-sheet-like contacts to the crystal lattice neighbor (pink). In the isolated monomer simulation, the “pull” from the crystal contact is absent, and Rosetta’s low energy models (gray) adopt a wide range of conformations that all collapse toward the body of the protein.
Fig. 6
Fig. 6
Comparison of X-ray, computed, and NMR ensembles (a–c) Simulation of immunophilin FK506 binding protein (1FKB) yields a funnel-like landscape with a well-converged minimum at ~1Å from the deposited coordinates. Examination of the lowest-energy models revealed a core perfectly superimposable (including the sidechains) but with subtle differences in the loops. a) Superposition of 21 different crystal structures (13). b) Rosetta ensemble of lowest-energy models. c) NMR ensemble from 1FKR. The structural flexibility of the Rosetta ensemble (green), particularly in the loops, exceeds that implied by the B-factors of any given crystal structure, and better matches the ensemble of multiple crystal structures (blue). The NMR ensemble (red) displays even more variability, with complete disorder around a somewhat different conformation in the upper loop.
Fig. 7
Fig. 7
Illustration of the influence of crystal packing interactions on energy landscapes for an external loop. a) The isolated monomer simulation of human beta2-microglobulin (2D4F) identifies a considerably deeper minimum at ~3–4Å CaRMSD from the deposited structure. (Note that the core 92 of 109 residues still superimpose to 1.3Å CaRMSD.) The inset shows the lowest-energy models (green) superimposed on 2D4F (red) and an alternative crystal structure in a different crystal environment (1A9B, blue). Note the loop (residues 12–21), which differs greatly from 2D4F but makes extensive interactions with the main body of the protein in the Rosetta models, in 1A9B, and in NMR structure 1JNJ (not shown). b) Simulation in the crystal environment (using the 2D4F lattice parameters) shifts the deep energy minimum such that the conformation in the deposited crystal structure is now the most favorable, with loop 12–21 making extensive crystal contacts with neighboring unit cells (gray).
Fig. 8
Fig. 8
Correction of local errors in a deposited crystal structure. a) MolProbity detects errors by several criteria for Thr77 and Thr101 in a crystal structure of calponin homology domain (1BKR): rotamer outliers, Cβ deviations (pink balls), and steric clashes (pink spikes) to surrounding waters (brown balls) and protein atoms (to a Lys sidechain of another molecule in the crystal in the case of Thr77). Furthermore, the Cβ atoms for both Thr sidechains fall nearer to negative 5σ Fo–Fc difference density peaks (orange mesh) than to positive peaks (green mesh), indicating a mismatch to the experimental data. b) The majority of Rosetta’s low energy models (blue) flip both sidechains by 180° (30) to eliminate clashes, establish hydrogen bonds with surrounding atoms, and fortuitously better fit the difference density. A structure independently re-refined against the original diffraction data by the Richardson Lab (green) corroborates this flip. Note that Rosetta’s backbone is somewhat mobile, especially for Thr77, perhaps because stabilizing effects from the explicit water molecules and the crystal contact are not modeled. Nevertheless, in this case at least, Rosetta’s energy function is sufficient to detect the proper sidechain conformations.
Fig. 9
Fig. 9
Example of an erroneous computed alternate conformation. For the protein JW1657 from E. coli (1WD6, brown), an explicit water molecule (brown ball) peels apart the two strands of a parallel β sheet while maintaining excellent hydrogen bonds (green dots) to maintain the protein’s structural integrity. Rosetta cannot consider the possibility of an explicit water molecule because it employs an implicit solvent model; therefore the computed low energy models revert to overly idealized (and in this case incorrect) β structure. The low B-factor (13.8) of the water suggests it is well ordered and precisely placed, and chain B of 1WD6 as well as other homologs confirm its position.
Fig. 10
Fig. 10
Discovery of a functionally relevant state in an active site. a) Score vs. CαRMSD plot for isolated monomer simulation of arsenate reductase (1JFV). The y-axis is the Rosetta all-atom energy and the x-axis the CαRMSD from the crystal structure; red dots are models relaxed from the crystal structure. Rosetta identifies two distinct low-energy funnels, suggesting the presence of two nearly isoenergetic yet distinct states in the real protein. b) Arsenate reductase undergoes a Cys10-Cys82-Cys89 disulfide cascade as part of its reaction cycle. The oxidized crystal structure 1JFV (brown) has a C10S mutation to capture the end point of this cascade, SS 82–89 (yellow). Some of the low energy models from the isolated monomer simulation (blue) match the disulfide-flanked loop in the oxidized crystal structure (left funnel in part a), but most adopt a disulfide-free miniature helix instead (right funnel in part a). A reduced form of the protein (1JF8, not shown) and a double C10S/C82S mutant (1RXI, green) corroborate the computed alternate conformation as a valid stage in the reaction cycle. Perchlorate ions appear in both 1JFV and 1RXI (brown and green tetrahedra) and thus appear not to strongly bias the loop conformation. The fact that the alternate energy minimum persists in the crystal lattice simulation argues against the possibility that crystal contacts to the loop in 1JFV significantly influence its energy relative to that of the alternate helix.

Similar articles

Cited by

References

    1. Bradley P, Misura KMS, Baker D. Toward high-resolution de novo structure prediction for small proteins. Science. 2005;309:1868–1871. - PubMed
    1. Qian B, et al. High-resolution structure prediction and the crystallographic phase problem. Nature. 2007;450:259–264. - PMC - PubMed
    1. Das R, et al. Structure prediction for CASP7 targets using extensive all-atom refinement with Rosetta@HOME. Proteins: Struc Func Bioinf. 2007;69 Suppl 8:118–128. - PubMed
    1. Kuhlman B, et al. Design of a Novel Globular Protein Fold with Atomic-Level Accuracy. Science. 2003;302:1364–1368. - PubMed
    1. Jiang L, et al. De novo computational design of retro-aldol enzymes. Science. 2008;319:1387–1391. - PMC - PubMed

Publication types

LinkOut - more resources