. 2010 Nov 10;18(11):1431-42.
doi: 10.1016/j.str.2010.09.009.

XLF regulates filament architecture of the XRCC4·ligase IV complex

Affiliations

XLF regulates filament architecture of the XRCC4·ligase IV complex

Michal Hammel et al. Structure. .

Abstract

DNA ligase IV (LigIV) is critical for nonhomologous end joining (NHEJ), the major DNA double-strand break (DSB) repair pathway in human cells, and LigIV activity is regulated by XRCC4 and XLF (XRCC4-like factor) interactions. Here, we employ small angle X-ray scattering (SAXS) data to characterize three-dimensional arrangements in solution for full-length XRCC4, XRCC4 in complex with LigIV tandem BRCT domains and XLF, plus the XRCC4·XLF·BRCT2 complex. XRCC4 forms tetramers mediated through a head-to-head interface, and the XRCC4 C-terminal coiled-coil region folds back on itself to support this interaction. The interaction between XLF and XRCC4 is also mediated via head-to-head interactions. In the XLF·XRCC4·BRCT complex, alternating repeating units of XLF and XRCC4·BRCT place the BRCT domain on one side of the filament. Collective results identify XRCC4 and XLF filaments suitable to align DNA molecules and function to facilitate LigIV end joining required for DSB repair in vivo.


Figures

Figure 1
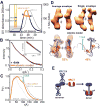
Figure 1. The XRCC4 C-terminal region supports the XRCC4-head to head interface
(A) SEC-MALS chromatograph of XRCC4 at 5.0 mg/ml. Solid lines represent the UV absorbance at 280nm and symbols represent molar mass vs. elution time. Magenta and blue regions represent the fractions collected for further SAXS measurement. Blue, SEC fraction of the XRCC4-dimer; magenta, the XRCC4 dimer-tetramer mixture at <1 mg/ml. Elution of filaments is indicated by the gray box. (B) Experimental scattering profiles of the SEC fractions. Green, XRCC4 at 3.0 mg/ml without prior SEC preparation. This sample was filtrated with 1 MDa cut-off filter to eliminate filaments. Magenta and blue are as panel A. The theoretical scattering of the final MES models for XRCC4 (blue line, χ2=1.4), and a multi-component model of XRCC4 dimer-tetramer mixtures are shown (magenta line, χ2=1.4, 11% tetramer 89%.dimer; green line, χ2=1.8, 65% tetramer, 35% dimer). Inset - The Guinier plot with linear fit (violet line) in the limit qRG>1.3. The peak-distance at the 75-100Å interval is indicated (yellow bar). (C) P(r) of XRCC4 assemblies computed from the experimental SAXS data shown in the same colors as panel B. The P(r) functions are normalized to unity at their maxima. The peak-distance at the 75-100Å interval is indicated (yellow bar). (D) Top- Two views of the average SAXS envelopes of the XRCC4 assemblies colored as in panel B. Middle - MES - Atomic models for XRCC4 dimers (gold) and tetramers (blue-red) along with their respective percentages. The major conformer is superimposed with the average envelope and rotated by 90°. The black inset shows the XRCC4 dimer described in a recent EM study (Recuero-Checa et al., 2009). The 75-100Å distance observed in the SAXS data is indicated (yellow bar). (E) P(r) functions calculated for the SAXS curve of XRCC4 1-140 at 5.4 mg/ml and pH 7.0 (blue) or 8.0 (green) and XRCC4 1-161 at 5.4 mg/ml and pH 7.0 (light blue). Note the area at r>80Å corresponds to the residual amount of XRCC4 filaments formed through the head-to-head interaction. The theoretical P(r) for XRCC4 1-140 dimers and tetramers (cartoon model) are shown in orange and red, respectively. Inset - SDS-PAGE analysis of the XRCC4 1-140 and XRCC4 1-161 samples. (F) Cartoon describing formation of XRCC4 at high protein concentration. See also Figure S1.
Figure 2
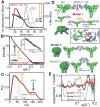
Figure 2. The LigIV tandem BRCT domain destabilizes XRCC4 filaments
(A) SEC-MALS chromatograph of the XRCC4·BRCT complex (black) compared to XRCC4 alone (gray). Solid lines represent the UV at 280nm and symbols represent molar mass vs. elution time. The orange region represents the fraction collected for SAXS measurements. Note the absence of filaments for the XRCC4·BRCT complex (gray box). Inset - SDS-PAGE analysis of the peak fraction. (B) Experimental scattering profiles for the collected XRCC4·BRCT fraction at ~1.0 mg/ml. The theoretical scattering (orange line, χ2=2.4) from the MES-model as shown in panel D. Inset - The Guinier plot with linear fit (red line). (C) P(r) of the XRCC4·BRCT complex (orange) computed from the experimental SAXS data compared to the P(r) obtained for XRRC4-dimers and tetramers (light and dark gray, respectively). The P(r) functions are normalized to unity at their maxima. The average distance of the XRCC4 head domain to the BRCT domain (~110Å) is indicated. (D) Top- Two views of the average and representative single SAXS envelopes of the XRCC4·BRCT complex. Bottom - MES atomic models for XRCC 4·BRCT along with their respective percentages. The main conformer is superimposed on the average envelope and rotated by 90°. The distance observed in the SAXS data is indicated. (E) Cartoon illustrating disruption of the XRCC4-tetramer upon BRCT complexation. See also Figure S2.
Figure 3
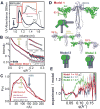
Figure 3. Formation of XLF ·XRCC4 filaments
(A) SEC-MALS chromatograph of XLF·XRCC4 1-140 (black) compared to XLF and XRCC4 (1-140) (gray, light gray). Solid lines represent the UV at 280nm, and the symbols represent molar mass vs. elution time. The red region represents the fraction collected for SAXS measurement. Inset - SDS-PAGE analysis of the fraction. (B) Experimental scattering profiles of the collected XLF·XRCC4 (1-140) fraction at 1.0 mg/ml. The theoretical scattering (red line) from the final MES-model shown in panel D (χ2=2.4). Two distinct spacings at 80Å and 160Å (yellow and blue arrow) are identical for experimental and theoretical profiles. Inset - The Guinier plot with linear fit (violet line). (C) P(r) of XLF·XRCC4 1-140 (red) in comparison to XLF and XRCC4 1-140 (gray, and light gray respectively). The P(r) functions are normalized to unity at their maxima and distances at 80Å and 160Å are indicated. (D) (top) Ensemble for atomic model 1 of XLF·XRCC4 1-140 along with respective percentages. The distances (80 and 160Å) observed in the SAXS data are indicated. Zoom-in of the reconstructed XLF·XRCC4 1-140 complex showing the interaction-interface and residues K65, K99 and K102 of XRRC4 and L115 of XLF. Model 2 and model 3 are shown as cartoons describing overall arrangements. (E) Fit for the MES model 1 (shown in panel D), model 2 (tetramer 45%, hexamer 25 %, octamer 30%) and model 3 (tetramer 30%, hexamer 0 %, octamer 70%). The fits are shown as residuals. See also Figure S3.
Figure 4
Figure 4. Overall arrangement of the full length XRCC4·XLF filament
(A) SEC chromatograph of XLF·XRCC4 (black) compared to XLF·XRCC4·BRCT (gray). The red region represents the fraction collected for SAXS measurement. (B) Experimental scattering profiles of the collected XLF·XRCC4 peak fraction at ~1.0 mg/ml (red) and after dilution to 0.5 mg/ml (violet). The theoretical scattering from the final MES-model shown in panel D is shown as a red (undiluted) or violet (diluted) line matching the experimental data (χ2=1.8, undiluted; χ2=1.3, diluted sample). Two distinct spacing at 80Å (yellow arrow) is identical for experimental and theoretical profiles. Inset - The Guinier plot with linear fit (violet line). (C) P(r) of XLF·XRCC4 (red for undiluted and violet for dilution sample) in comparison to XRCC4·BRCT·XLF (gray). The P(r) functions are normalized to unity at their maxima. Two distinct distances at 80Å (yellow arrow) and 160Å (blue arrow) are indicated. (D) Ensemble for atomic model 1 along with respective percentages. Model 2 and model 3 are shown as cartoons describing overall arrangements. (E) Fits for the MES models shown in panel D and Figure S4B. The fits are shown as residuals. See also Figure S4.
Figure 5
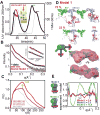
Figure 5. Dynamic nature of the XLF·XRCC4·BRCT filament
(A) SEC-MALS chromatograph of XLF·XRCC4·BRCT (black) in comparison to XRCC4·BRCT (gray). Solid lines represent the UV at 280nm, and the symbols represent molar mass. The red region represents the fraction collected for SAXS measurements. Inset - SDS-PAGE analysis of the peak-fractions. (B) Experimental scattering profiles of the collected XLF·XRCC4·BRCT fraction diluted to 1.0 mg/ml (violet) and the peak-fraction at ~3.0 mg/ml (red). The theoretical scattering from the final MES-models (shown in panel D) is shown as a solid line matching the experimental data (χ2=2.4 for the undiluted peak fraction, red; and χ2=1.3 for the diluted peak fraction, violet). Inset - The Guinier plot with linear fit (violet line). (C) P(r) of XLF·XRCC4·BRCT calculated for the diluted fraction (violet) and undiluted peak-fraction (red) in comparison to XRCC4·BRCT (gray). The P(r) functions are normalized to unity at their first maxima r= 30Å. The average distance of the XRCC4 head domain to the BRCT domain (~110Å) is indicated by the yellow arrow. (D) Top- MES-atomic models of XLF·XRCC4·BRCT calculated for the diluted sample shown along with their respective percentages. bottom- Two views of the average SAXS envelope of undiluted XLF·XRCC4·BRCT complex. The envelope is superimposed on the main component of the MES model. (E) Fit for the MES model 1, model 2 (tetramer 48%, hexamer 20 %, octamer 32%) and model 3 (tetramer 68%, octamer 15%, decamer 17%). The fits are shown as residuals. See also Figure S5.

Similar articles

Cited by

References

    1. Ahnesorg P, Smith P, Jackson SP. XLF interacts with the XRCC4-DNA ligase IV complex to promote DNA nonhomologous end-joining. Cell. 2006;124:301–313. - PubMed
    1. Andres SN, Modesti M, Tsai CJ, Chu G, Junop MS. Crystal Structure of Human XLF: A Twist in Nonhomologous DNA End-Joining. Mol Cell. 2007;28:1093–1101. - PubMed
    1. Bernado P, Mylonas E, Petoukhov MV, Blackledge M, Svergun DI. Structural characterization of flexible proteins using small-angle X-ray scattering. J Am Chem Soc. 2007;129:5656–5664. - PubMed
    1. Buck D, Malivert L, de Chasseval R, Barraud A, Fondaneche MC, Sanal O, Plebani A, Stephan JL, Hufnagel M, le Deist F, et al. Cernunnos, a novel nonhomologous end-joining factor, is mutated in human immunodeficiency with microcephaly. Cell. 2006;124:287–299. - PubMed
    1. Callebaut I, Malivert L, Fischer A, Mornon JP, Revy P, de Villartay JP. Cernunnos interacts with the XRCC4 x DNA-ligase IV complex and is homologous to the yeast nonhomologous end-joining factor Nej1. J Biol Chem. 2006;281:13857–13860. - PubMed

Publication types

MeSH terms