

Point mutations in c-Myc uncouple neoplastic transformation from multiple other phenotypes in rat fibroblasts
- PMID: 21060841
- PMCID: PMC2965668
- DOI: 10.1371/journal.pone.0013717
Point mutations in c-Myc uncouple neoplastic transformation from multiple other phenotypes in rat fibroblasts
Abstract
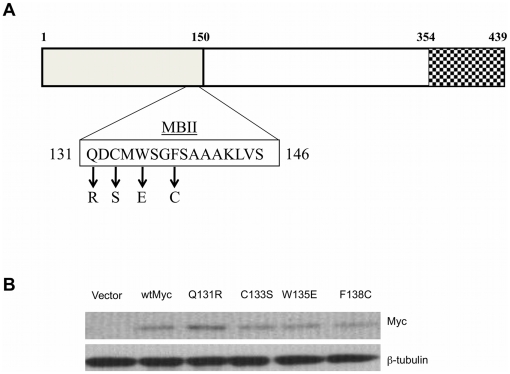
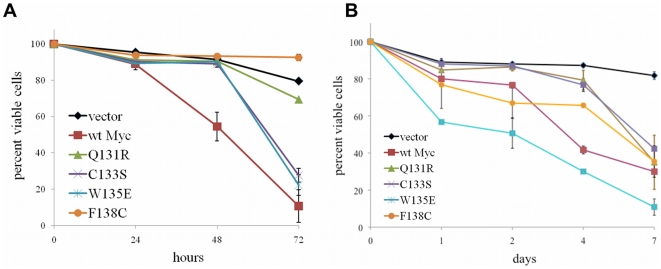
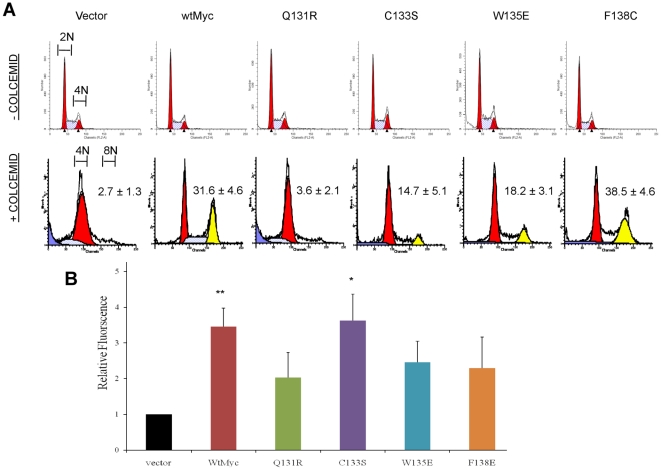
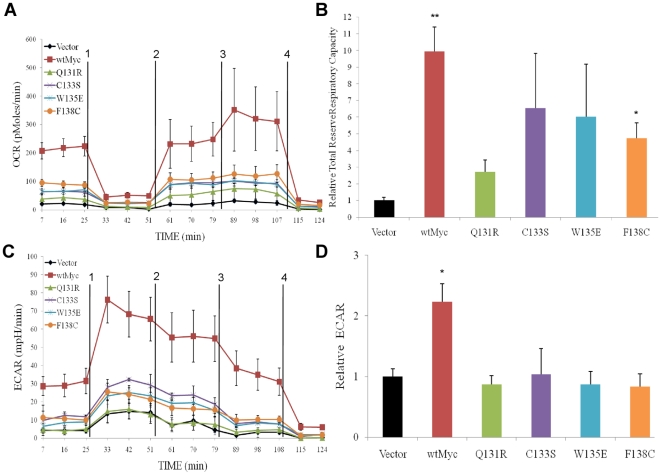
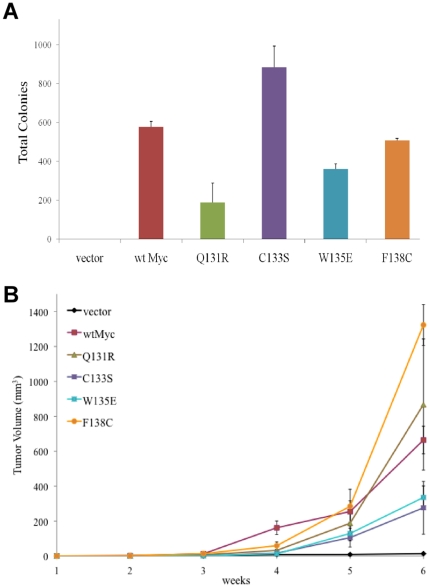
Deregulation of c-Myc (Myc) occurs in many cancers. In addition to transforming various cell types, Myc also influences additional transformation-associated cellular phenotypes including proliferation, survival, genomic instability, reactive oxygen species production, and metabolism. Although Myc is wild type in most cancers (wtMyc), it occasionally acquires point mutations in certain lymphomas. Some of these mutations confer a survival advantage despite partially attenuating proliferation and transformation. Here, we have evaluated four naturally-occurring or synthetic point mutations of Myc for their ability to affect these phenotypes, as well as to promote genomic instability, to generate reactive oxygen species and to up-regulate aerobic glycolysis and oxidative phosphorylation. Our findings indicate that many of these phenotypes are genetically and functionally independent of one another and are not necessary for transformation. Specifically, the higher rate of glucose metabolism known to be associated with wtMyc deregulation was found to be independent of transformation. One mutation (Q131R) was greatly impaired for nearly all of the studied Myc phenotypes, yet was able to retain some ability to transform. These findings indicate that, while the Myc phenotypes examined here make additive contributions to transformation, none, with the possible exception of increased reliance on extracellular glutamine for survival, are necessary for achieving this state.
Conflict of interest statement
Figures


Similar articles
-
c-Myc: linking transformation and genomic instability.Curr Mol Med. 2008 Sep;8(6):446-58. doi: 10.2174/156652408785747988. Curr Mol Med. 2008. PMID: 18781952 Review.
-
Multiple phenotypes associated with Myc-induced transformation of chick embryo fibroblasts can be dissociated by a basic region mutation.Nucleic Acids Res. 1996 Aug 15;24(16):3216-21. doi: 10.1093/nar/24.16.3216. Nucleic Acids Res. 1996. PMID: 8774903 Free PMC article.
-
MYC-induced cancer cell energy metabolism and therapeutic opportunities.Clin Cancer Res. 2009 Nov 1;15(21):6479-83. doi: 10.1158/1078-0432.CCR-09-0889. Epub 2009 Oct 27. Clin Cancer Res. 2009. PMID: 19861459 Free PMC article. Review.
-
A modest reduction in c-myc expression has minimal effects on cell growth and apoptosis but dramatically reduces susceptibility to Ras and Raf transformation.Cancer Res. 2001 Feb 1;61(3):1178-86. Cancer Res. 2001. PMID: 11221849
-
A link between c-Myc-mediated transcriptional repression and neoplastic transformation.J Clin Invest. 1996 Apr 1;97(7):1687-95. doi: 10.1172/JCI118595. J Clin Invest. 1996. PMID: 8601634 Free PMC article.
Cited by
-
β-catenin is a central mediator of pro-fibrotic Wnt signaling in systemic sclerosis.Ann Rheum Dis. 2012 May;71(5):761-7. doi: 10.1136/annrheumdis-2011-200568. Epub 2012 Feb 10. Ann Rheum Dis. 2012. PMID: 22328737 Free PMC article.
-
Oxidants and not alkylating agents induce rapid mtDNA loss and mitochondrial dysfunction.DNA Repair (Amst). 2012 Aug 1;11(8):684-92. doi: 10.1016/j.dnarep.2012.06.002. Epub 2012 Jul 4. DNA Repair (Amst). 2012. PMID: 22766155 Free PMC article.
-
The rate of oxygen utilization by cells.Free Radic Biol Med. 2011 Aug 1;51(3):700-12. doi: 10.1016/j.freeradbiomed.2011.05.024. Epub 2011 May 27. Free Radic Biol Med. 2011. PMID: 21664270 Free PMC article.
-
c-Myc induction of programmed cell death may contribute to carcinogenesis: a perspective inspired by several concepts of chemical carcinogenesis.Cancer Biol Ther. 2011 Apr 1;11(7):615-26. doi: 10.4161/cbt.11.7.14688. Epub 2011 Apr 1. Cancer Biol Ther. 2011. PMID: 21278493 Free PMC article. Review.
-
Metabolic symbiosis in cancer: refocusing the Warburg lens.Mol Carcinog. 2013 May;52(5):329-37. doi: 10.1002/mc.21863. Epub 2012 Jan 6. Mol Carcinog. 2013. PMID: 22228080 Free PMC article. Review.
References
-
- Nesbit CE, Tersak JM, Prochownik EV. MYC oncogenes and human neoplastic disease. Oncogene. 1999;18:3004–3016. - PubMed
-
- Boxer LM, Dang CV. Translocations involving c-myc and c-myc function. Oncogene. 2001;20:5595–5610. - PubMed
-
- Seth A, Alvarez E, Gupta S, Davis RJ. A phosphorylation site located in the NH2-terminal domain of c-Myc increases transactivation of gene expression. J Biol Chem. 1991;266:23521–23524. - PubMed
-
- Rabbitts TH, Hamlyn PH, Baer R. Altered nucleotide sequences of a translocated c-myc gene in Burkitt lymphoma. Nature. 1983;306:760–765. - PubMed
-
- Yano T, Sander CA, Clark HM, Dolezal MV, Jaffe ES, et al. Clustered mutations in the second exon of the MYC gene in sporadic Burkitt's lymphoma. Oncogene. 1993;8:2741–2748. - PubMed
Publication types
MeSH terms
Grants and funding
LinkOut - more resources
Full Text Sources
Other Literature Sources
