Reciprocal intronic and exonic histone modification regions in humans
- PMID: 21057525
- PMCID: PMC3057557
- DOI: 10.1038/nsmb.1924
Reciprocal intronic and exonic histone modification regions in humans
Abstract
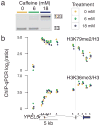
While much attention has been focused on chromatin at promoters and exons, human genes are mostly composed of intronic sequences. Analyzing published surveys of nucleosomes and 41 chromatin marks in humans, we identified histone modifications specifically associated with 5' intronic sequences, distinguishable from promoter marks and bulk nucleosomes. These intronic marks were spatially reciprocal to trimethylated histone H3 Lys36 (H3K36me3), typically transitioning near internal exons. Several marks transitioned near bona fide exons, but not near nucleosomes at exon-like sequences. Therefore, we examined whether splicing affects histone marking. Even with considerable changes in regulated alternative splicing, histone marks were stable. Notably, these findings are consistent with exon definition influencing histone marks. In summary, we show that the location of many intragenic marks in humans can be distilled into a simple organizing principle: association with 5' intronic or 3' exonic regions.
Figures


Similar articles
-
Differential patterns of intronic and exonic DNA regions with respect to RNA polymerase II occupancy, nucleosome density and H3K36me3 marking in fission yeast.Genome Biol. 2011 Aug 22;12(8):R82. doi: 10.1186/gb-2011-12-8-r82. Genome Biol. 2011. PMID: 21859475 Free PMC article.
-
Differential chromatin marking of introns and expressed exons by H3K36me3.Nat Genet. 2009 Mar;41(3):376-81. doi: 10.1038/ng.322. Epub 2009 Feb 1. Nat Genet. 2009. PMID: 19182803 Free PMC article.
-
Contrasting chromatin organization of CpG islands and exons in the human genome.Genome Biol. 2010;11(7):R70. doi: 10.1186/gb-2010-11-7-r70. Epub 2010 Jul 5. Genome Biol. 2010. PMID: 20602769 Free PMC article.
-
Regulation of alternative splicing by local histone modifications: potential roles for RNA-guided mechanisms.Nucleic Acids Res. 2014 Jan;42(2):701-13. doi: 10.1093/nar/gkt875. Epub 2013 Sep 29. Nucleic Acids Res. 2014. PMID: 24081581 Free PMC article. Review.
-
Histone H3K4 trimethylation: dynamic interplay with pre-mRNA splicing.Biochem Cell Biol. 2016 Feb;94(1):1-11. doi: 10.1139/bcb-2015-0065. Epub 2015 Jul 15. Biochem Cell Biol. 2016. PMID: 26352678 Review.
Cited by
-
New insights from existing sequence data: generating breakthroughs without a pipette.Mol Cell. 2013 Feb 21;49(4):605-17. doi: 10.1016/j.molcel.2013.01.031. Mol Cell. 2013. PMID: 23438857 Free PMC article.
-
H2B ubiquitylation is part of chromatin architecture that marks exon-intron structure in budding yeast.BMC Genomics. 2011 Dec 22;12:627. doi: 10.1186/1471-2164-12-627. BMC Genomics. 2011. PMID: 22188810 Free PMC article.
-
ZBTB24 is a transcriptional regulator that coordinates with DNMT3B to control DNA methylation.Nucleic Acids Res. 2018 Nov 2;46(19):10034-10051. doi: 10.1093/nar/gky682. Nucleic Acids Res. 2018. PMID: 30085123 Free PMC article.
-
Divergent transcription is associated with promoters of transcriptional regulators.BMC Genomics. 2013 Dec 23;14:914. doi: 10.1186/1471-2164-14-914. BMC Genomics. 2013. PMID: 24365181 Free PMC article.
-
Flickin' the ubiquitin switch: the role of H2B ubiquitylation in development.Epigenetics. 2011 Oct 1;6(10):1165-75. doi: 10.4161/epi.6.10.17745. Epub 2011 Oct 1. Epigenetics. 2011. PMID: 21937884 Free PMC article. Review.
References
-
- Berger SL. The complex language of chromatin regulation during transcription. Nature. 2007;447:407–12. - PubMed
-
- Kouzarides T. Chromatin modifications and their function. Cell. 2007;128:693–705. - PubMed
-
- Loyola A, Almouzni G. Marking histone H3 variants: how, when and why? Trends Biochem Sci. 2007;32:425–33. - PubMed
-
- Lee BM, Mahadevan LC. Stability of histone modifications across mammalian genomes: Implications for ‘epigenetic’ marking. J Cell Biochem. 2009;108:22–34. - PubMed
-
- Talbert PB, Henikoff S. Histone variants--ancient wrap artists of the epigenome. Nat Rev Mol Cell Biol. 2010;11:264–275. - PubMed
Publication types
MeSH terms
Substances
Grants and funding
LinkOut - more resources
Full Text Sources
Other Literature Sources

