. 2010 Oct 26;8(10):e1000530.
doi: 10.1371/journal.pbio.1000530.

iCLIP predicts the dual splicing effects of TIA-RNA interactions

Affiliations

iCLIP predicts the dual splicing effects of TIA-RNA interactions

Zhen Wang et al. PLoS Biol. .

Abstract

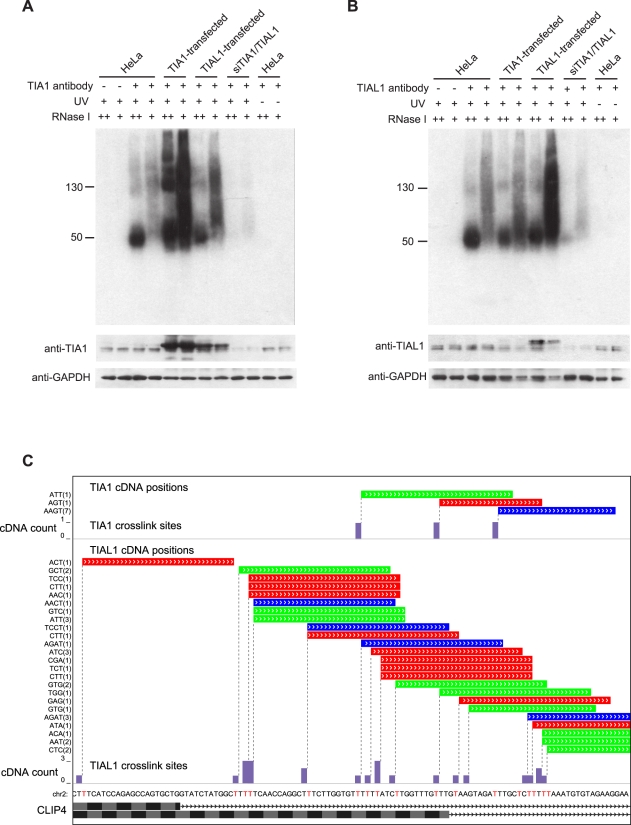
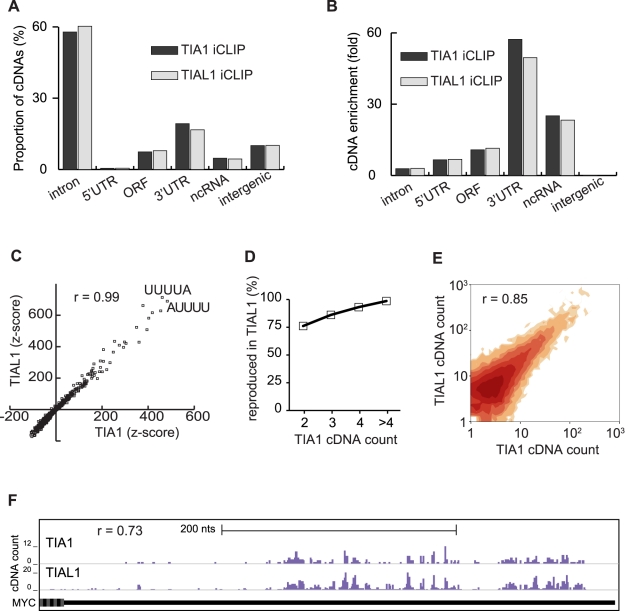
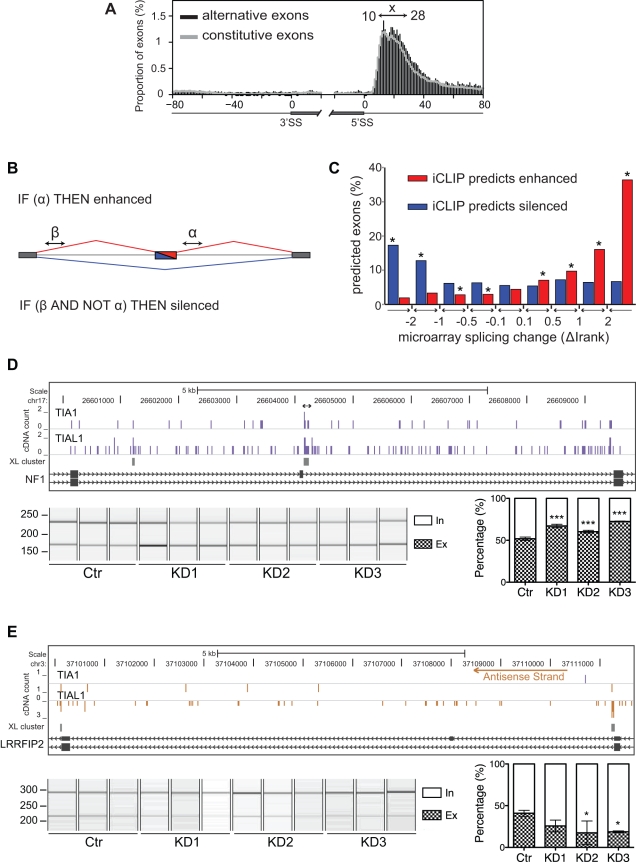
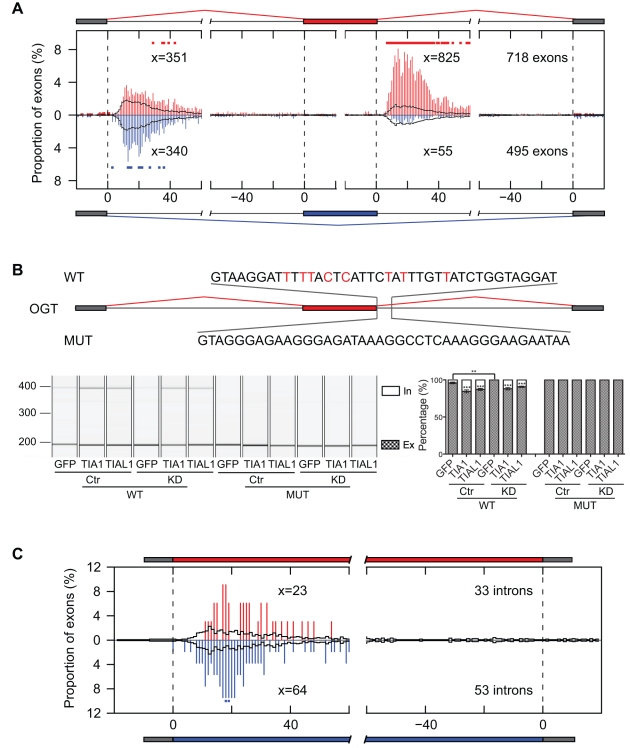
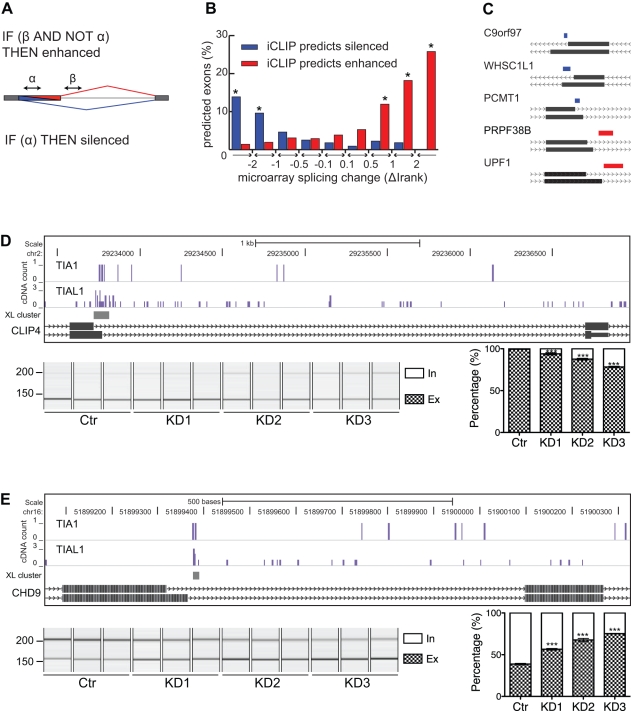
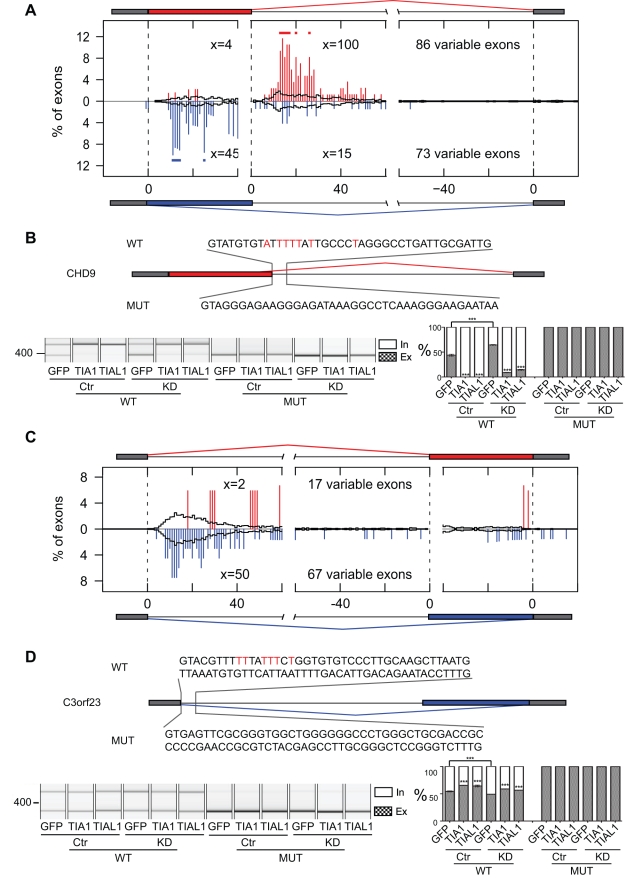
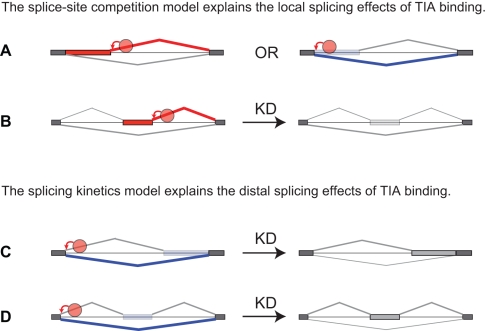
The regulation of alternative splicing involves interactions between RNA-binding proteins and pre-mRNA positions close to the splice sites. T-cell intracellular antigen 1 (TIA1) and TIA1-like 1 (TIAL1) locally enhance exon inclusion by recruiting U1 snRNP to 5' splice sites. However, effects of TIA proteins on splicing of distal exons have not yet been explored. We used UV-crosslinking and immunoprecipitation (iCLIP) to find that TIA1 and TIAL1 bind at the same positions on human RNAs. Binding downstream of 5' splice sites was used to predict the effects of TIA proteins in enhancing inclusion of proximal exons and silencing inclusion of distal exons. The predictions were validated in an unbiased manner using splice-junction microarrays, RT-PCR, and minigene constructs, which showed that TIA proteins maintain splicing fidelity and regulate alternative splicing by binding exclusively downstream of 5' splice sites. Surprisingly, TIA binding at 5' splice sites silenced distal cassette and variable-length exons without binding in proximity to the regulated alternative 3' splice sites. Using transcriptome-wide high-resolution mapping of TIA-RNA interactions we evaluated the distal splicing effects of TIA proteins. These data are consistent with a model where TIA proteins shorten the time available for definition of an alternative exon by enhancing recognition of the preceding 5' splice site. Thus, our findings indicate that changes in splicing kinetics could mediate the distal regulation of alternative splicing.


Conflict of interest statement

The authors have declared that no competing interests exist.

Figures

Figure 1
Figure 1. iCLIP identifies the TIA1 and TIAL1 crosslink sites with nucleotide resolution.
Autoradiogram of 32P-labelled RNA crosslinked to TIA1 (A) or TIAL1 (B) in HeLa cells. Immunoprecipitation was performed with either anti-TIA1 or anti-TIAL1 antibody using lysate from UV-crosslinked HeLa cells, cells transfected with TIA1 or TIAL1, TIA1/TIAL1 KD cells, or non-crosslinked cells. High and low RNase concentrations were used and protein G beads were used as a control. The Western blots below the autoradiograms show the input lysate used for each immunoprecipitation. (C) TIA1 and TIAL1 crosslink to uridine tracts downstream of the alternative 5′ splice sites in the CLIP4 gene. The cDNA positions are colour-coded for three replicate TIA1 and TIAL1 experiments, and the random barcode (shown on the left) is used to identify unique iCLIP cDNAs (number in brackets indicates the number of corresponding PCR duplicates). Below, the bar graphs show the cDNA count (number of cDNAs at each crosslink site). Pre-mRNA sequence is shown below with crosslink nucleotides in red. The exon and intron positions of the two isoforms of CLIP4 mRNA are shown at the bottom.
Figure 2
Figure 2. TIA1 and TIAL1 crosslink to the same positions in human RNAs.
(A) The percentage of cDNAs from TIA1 and TIAL1 iCLIP that mapped to different types of RNAs. (B) The fold enrichment of average cDNA density from TIA1 and TIAL1 iCLIP in different types of RNAs relative to the average cDNA density in the whole genome. (C) Pentamer z scores at the 21 nt sequence surrounding crosslink sites (−10 nt to +10 nt) are shown for TIA1 and TIAL1 iCLIP. The sequences of the two most enriched pentamers and the Pearson correlation coefficient (r) between the TIA1 and TIAL1 z scores are shown. (D) Reproducibility of TIA1 and TIAL1 crosslink clusters. Percentage of crosslink clusters with a given cDNA count in TIA1 iCLIP that were also identified in TIAL1 iCLIP is shown. (E) Contour plot comparing TIA1 and TIAL1 cDNA counts in the 46,970 crosslink clusters. The darkness of contours increases with the number of clusters. The Pearson correlation coefficient (r) between the TIA1 and TIAL1 cDNA counts in the clusters is shown. (F) Crosslink sites of TIA1 and TIAL1 in the 3′ UTR of the MYC gene. The bar graph shows the number of cDNAs that identified each crosslink site. The Pearson correlation coefficient (r) between the TIA1 and TIAL1 cDNA counts at individual nucleotides is shown.
Figure 3
Figure 3. iCLIP predicts the regulation of alternative cassette exons.
(A) The nucleotide-resolution RNA map of TIA1/TIAL1 iCLIP crosslink clusters at 5′ splice sites of constitutive (grey line) and alternative (black bars) exons. Percentage of exons containing crosslink sites in 20 nt of exonic and 80 nt of intronic sequence is shown. The region “x” 10–28 nt downstream of exon/intron boundaries contains 30-fold enrichment of crosslink events if compared by the last 20 nucleotides of exonic sequence. (B) Logic functions of the TIA iCLIP code that predict splicing regulation. α and β are regions 10–28 nt downstream of exon/intron boundaries that predict enhanced or silenced exons. (C) The exons analysed by the splice-junction microarray are divided into intervals relative to their splicing change, and percentage of exons predicted by iCLIP in each interval is shown. The stars mark those categories where predictions perform significantly better than on control exons (* p<0.05, Fisher's Exact Test). (D,E) iCLIP crosslink sites surrounding the enhanced exon 23a in NF1 pre-mRNA (D) and the silenced exon in LRRFIP2 pre-mRNA (E). The cDNA counts for TIA1 and TIAL1 are shown in bar graphs (blue bars represent crosslinking to the sense strand, and orange bars to the antisense strand of the genome), and the crosslink (XL) clusters (FDR<0.05) are marked with grey rectangles. The arrow above the bar graphs shows the previously identified TIA binding sites. RNA from KD cells prepared with three different siRNA oligonucleotides and their quantification was analysed by RT-PCR and capillary electrophoresis. Capillary electrophoresis image and signal quantification are shown below the bar graphs. Quantified transcripts including (in) or excluding (ex) the regulated alternative exon are marked on the right. Average quantification values of exon inclusion (white) and exclusion (grey) are given as a fraction of summed values. Error bars represent standard deviation of three replicates and p values are also calculated (* p<0.05, *** p<0.001, one-way ANOVA).
Figure 4
Figure 4. RNA maps of TIA-regulated cassette exons and introns.
RNA map showing the percentage of alternative cassette exons (A) or retained introns (C) with clustered TIA1/TIAL1 crosslink sites at exon/intron boundaries, including 20 nt of exonic and 60 nt of intronic sequence. The number of crosslink events at each region “x” 10–28 nt downstream of exon/intron boundaries and the total number of exons analysed are shown for silenced (ΔIrank ≤1, blue bars), enhanced (ΔIrank ≥1, red bars), and control exons (|ΔIrank| ≤0.1, black line). The positions with a significantly higher number of crosslinking events in TIA-regulated RNAs than in control are indicated by red or blue dots above bars (* p<0.05, Fisher's Exact Test). (B) Minigene validation of enhanced alternative cassette exon from OGT1 pre-mRNA. The schematic diagram of each isoforms is shown, and the TIA binding sites are zoomed in above, with crosslinking nucleotides in red. The mutated sequences are shown below. Capillary electrophoresis image and signal quantification are shown below. Quantified transcripts including (in) or excluding (ex) the regulated alternative exon are marked on the right. Average quantification values of exon inclusion (white) and exclusion (grey) are given as a fraction of summed values. Error bars represent standard deviation of three replicates and p values are also calculated for TIA1 and TIAL1 overexpression compared to GFP transfected cells in either control or KD situation (** p<0.01, *** p<0.001, one-way ANOVA).
Figure 5
Figure 5. iCLIP predicts the regulation of alternative 5′ splice sites.
(A) Logic functions of the TIA iCLIP code that predict splicing regulation. α and β are regions 10–28 nt downstream of exon/intron boundaries that predict enhanced or silenced exons. (B) The percentage of exons predicted by iCLIP is compared to the splicing change detected by microarray (* p<0.05, Fisher's Exact Test). (C) Diagrams showing a section of variable 5′ splice site isoforms of five pre-mRNAs (given on the left) predicted by iCLIP and validated by RT-PCR. The relative location of cDNA clusters is shown as a blue line at silenced and red line at enhanced variable exons. (D,E) iCLIP crosslink sites surrounding the enhanced variable-length exon in CLIP4 pre-mRNA (D) and silenced variable-length exon in CHD9 pre-mRNA (E). Depiction and labelling is as described in the legend for Figure 3D–E.
Figure 6
Figure 6. RNA maps of TIA-regulated variable-length exons.
RNA maps showing the percentage of variable 5′ splice site exons (A) or variable 3′ splice site exons (C) with clustered TIA1/TIAL1 crosslink sites at exon/intron boundaries of variable exons and flanking constitutive exons, including 20 nt of exonic, 40 nt of variable exonic, and 60 nt of intronic sequence. The number of crosslink events at each region “x” 10–28 nt downstream of exon/intron boundaries and the total number of exons analysed are shown for silenced (ΔIrank ≤1, blue bars), enhanced (ΔIrank ≥1, red bars), and control variable exons (|ΔIrank| ≤0.1, black line). The positions with a significantly higher number of crosslinking events in TIA-regulated RNAs than in control are indicated by red or blue dots above bars (* p<0.05, Fisher's Exact Test). Minigene validation of variable 5′ splice site exon in CHD9 pre-mRNA (B) and variable 3′ splice sites exon in C3orf23 pre-mRNA (D) are shown. Depiction and labelling is as described in the legend for Figure 4B.
Figure 7
Figure 7. An overview of the models of TIA-dependent splicing regulation.
(A) TIA proteins can directly regulate 5′ splice site competition by enhancing either intron-proximal or intron-distal 5′ splice sites. (B) TIA proteins directly regulate alternative cassette exon inclusion by enhancing 5′ splice sites. (C) TIA proteins promote the use of intron-distal alternative 3′ splice sites without directly modulating competition between the alternative 3′ splice sites. By enhancing 5′ splice site recognition, TIA proteins decrease the inclusion of the variable portion of the exon. The splicing kinetics model proposes that the splicing kinetics is affected by 5′ splice site recognition, which then indirectly affects the ability of SR proteins and other factors to define the variable portion of the distal exon. According to this model, the slower splicing kinetics in the absence of TIA increases the time available to these factors to promote inclusion of the variable portion of the exon. (D) Similar to the effect on distal variable exons, a change in splicing kinetics could contribute to the ability of TIA proteins to promote skipping of distal alternative cassette exon by binding at the upstream 5′ splice site.

Similar articles

Cited by

References

    1. Reed R. Mechanisms of fidelity in pre-mRNA splicing. Curr Opin Cell Biol. 2000;12:340–345. - PubMed
    1. Lim L. P, Burge C. B. A computational analysis of sequence features involved in recognition of short introns. Proc Natl Acad Sci U S A. 2001;98:11193–11198. - PMC - PubMed
    1. Blencowe B. J. Alternative splicing: new insights from global analyses. Cell. 2006;126:37–47. - PubMed
    1. Ule J, Stefani G, Mele A, Ruggiu M, Wang X, et al. An RNA map predicting Nova-dependent splicing regulation. Nature. 2006;444:580–586. - PubMed
    1. Tian Q, Streuli M, Saito H, Schlossman S. F, Anderson P. A polyadenylate binding protein localized to the granules of cytolytic lymphocytes induces DNA fragmentation in target cells. Cell. 1991;67:629–639. - PubMed

Publication types