. 2010 Nov 4;68(3):512-28.
doi: 10.1016/j.neuron.2010.09.020.

Single-cell optogenetic excitation drives homeostatic synaptic depression

Affiliations

Single-cell optogenetic excitation drives homeostatic synaptic depression

Carleton P Goold et al. Neuron. .

Abstract

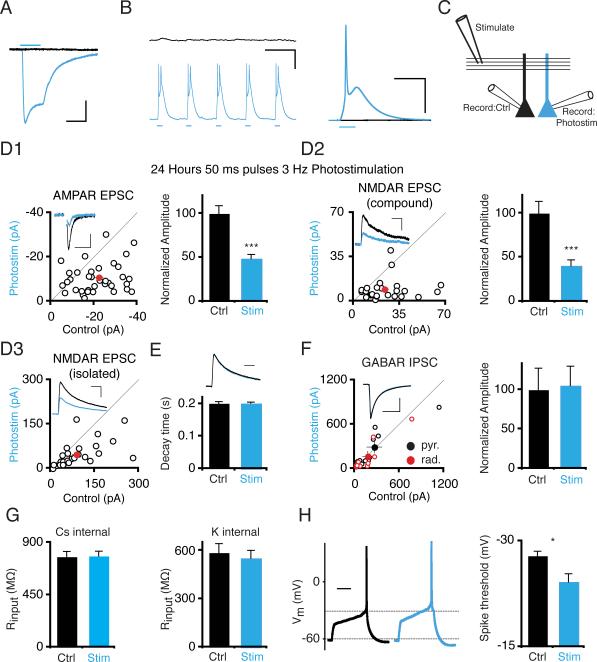
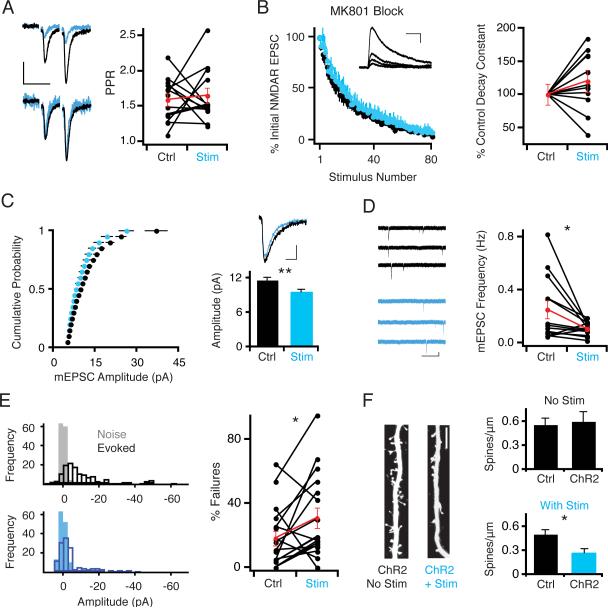
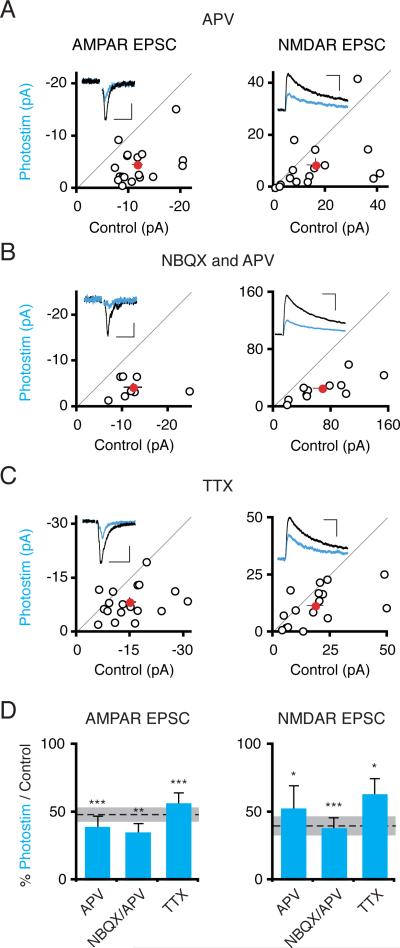
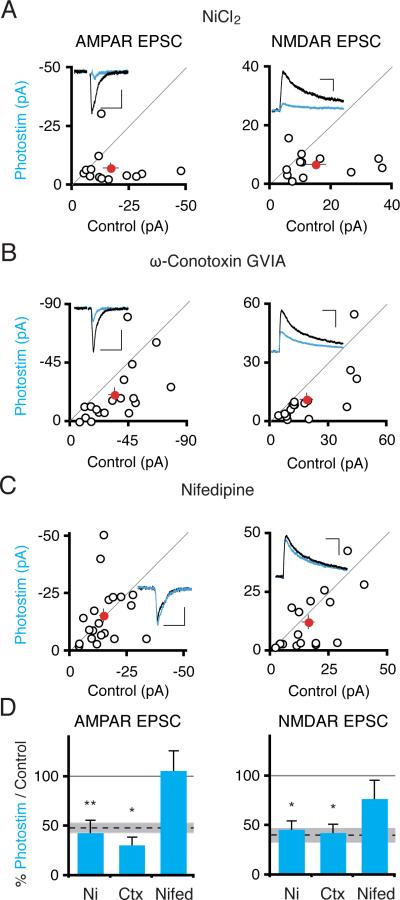
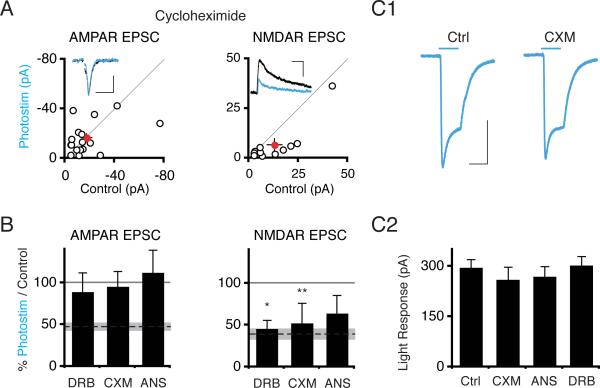
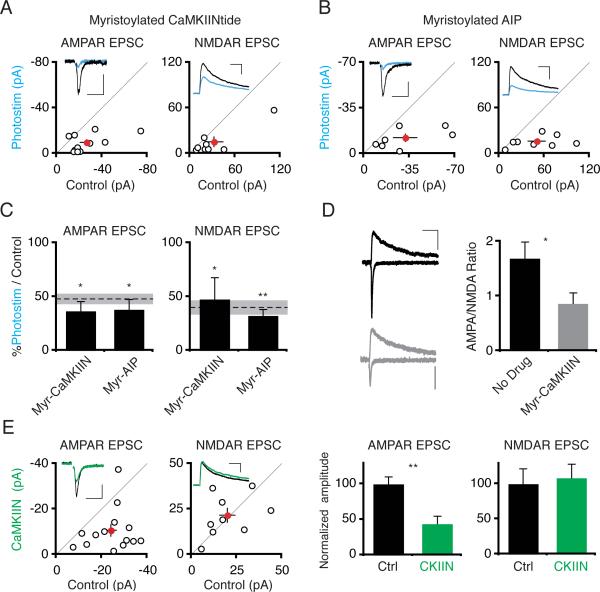
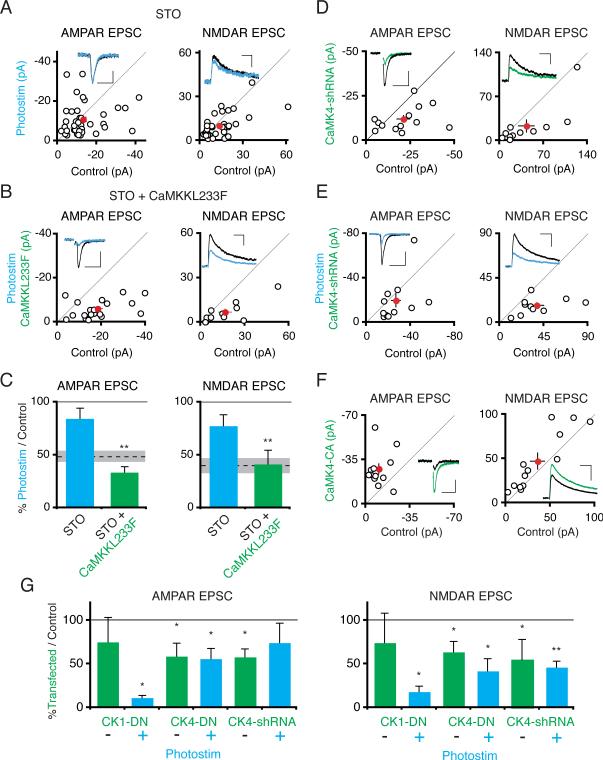
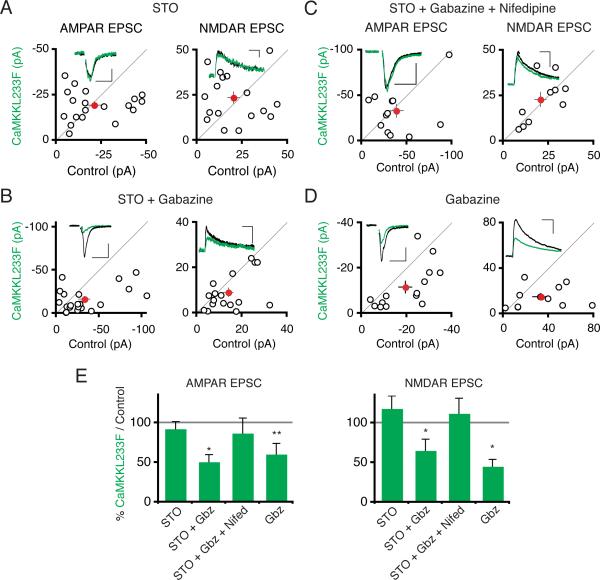
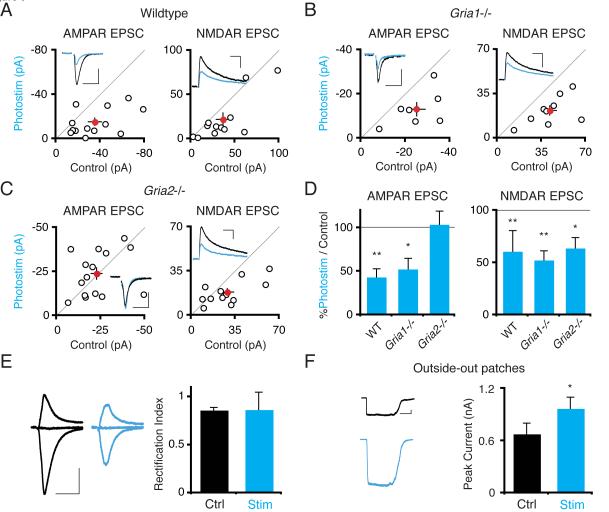
Homeostatic processes have been proposed to explain the discrepancy between the dynamics of synaptic plasticity and the stability of brain function. Forms of synaptic plasticity such as long-term potentiation alter synaptic activity in a synapse- and cell-specific fashion. Although network-wide excitation triggers compensatory homeostatic changes, it is unknown whether neurons initiate homeostatic synaptic changes in response to cell-autonomous increases in excitation. Here we employ optogenetic tools to cell-autonomously excite CA1 pyramidal neurons and find that a compensatory postsynaptic depression of both AMPAR and NMDAR function results. Elevated calcium influx through L-type calcium channels leads to activation of a pathway involving CaM kinase kinase and CaM kinase 4 that induces synaptic depression of AMPAR and NMDAR responses. The synaptic depression of AMPARs but not of NMDARs requires protein synthesis and the GluA2 AMPAR subunit, indicating that downstream of CaM kinase activation divergent pathways regulate homeostatic AMPAR and NMDAR depression.


Figures

Figure 1
Figure 1. 24 Hour Photostimulation Induces Depression of AMPAR and NMDAR Synaptic Responses in CA1 Pyramidal Cells
(A) Voltage-clamp recording at −70 mV of inward current induced by 50 ms blue light pulse on ChR2-transfected CA1 pyramidal cell (blue trace) and simultaneously recorded control cell (black trace). Scale: 50 ms, 100 pA. (B) (Left) Single sweep from simultaneous current-clamp recording of ChR2-transfected and control cell. Blue light pulses elicit sustained trains of depolarizations in ChR2 cells. Scale: 333 ms, 25 mV. (Right) Average of 80 traces during 50 ms light pulses from different ChR2- and control cell pair, recorded simultaneously. Light does not evoke synaptic activity in the control cell. Scale: 100 ms, 25 mV. (C) Recording configuration. Synaptic responses to a shared presynaptic input in ChR2-transfected and control neurons are compared using simultaneous whole-cell recording. (D) Scatter plot of EPSCs from single pairs (open circles) and mean ± SEM (red circle) of simultaneously recorded ChR2-transfected (Stim) and control neurons (Ctrl) from slices photostimulated 24 hours with 50 ms light pulses at 3 Hz. Photostimulation causes a significant depression of both AMPAR and NMDAR responses in ChR2-transfected neurons. Insets are representative traces. (D1) AMPAR EPSCs recorded at −70 mV. (D2) Compound EPSCs recorded at +40 mV. NMDAR response is measured 100 ms after stimulus. (D3) Pharmacologically isolated NMDAR response recorded at +40 mV, measured at peak. Scale: D1: 50 ms, 10 pA; D2: 100 ms, 20 pA; D3: 100 ms, 50 pA. *, P < .05, **, P < .01; ***, P < .001. (E) No change in decay time constants of NMDAR responses. Inset: representative scaled NMDAR responses. Scale: 100 ms. (F) Scatter plot of IPSCs. IPSCs were elicited with stimulating electrodes positioned either in stratum pyramidale or radiatum. Open circles represent single pairs, closed circles mean ± SEM. Graph shows normalized mean amplitude ± SEM for pooled IPSCs; there is no significant change in IPSC amplitude in ChR2-transfected neurons vs. control neurons. Scale: 100 ms, 300 pA. (G) Input resistance, measured using Cs- or K-based internal solution. There is no significant difference between photostimulated and control neuron input resistance in either condition. (H) Photostimulated neurons have a significantly more depolarized threshold for action potential threshold. (Left) Representative traces, showing response to minimal current injection necessary to elicit action potentials in control and photostimulated neuron. Scale: 200 ms. See also Figure S1.
Figure 2
Figure 2. Photostimulation-Induced Synaptic Depression Involves Postsynaptic Synapse Elimination
(A) No significant difference in paired pulse ratio measured in ChR2-transfected and control neurons after 24 hour photostimulation. (Left) Sample traces. Scale: 50 ms, 15 pA. (B) Plot of averaged NMDAR response amplitude, normalized to first response, versus stimulus number in the presence of the use-dependent irreversible NMDAR antagonist MK-801. Inset: representative traces showing progressive block of NMDAR currents in the presence of MK-801. Scale: 100 ms, 25 pA. (Right) Time constants for NMDAR current decay for each paired recording. Values for each pair are normalized to the control cell time constant. There was no significant change between ChR2-transfected and control neurons after photostimulation. (C) Cumulative distribution of mEPSC amplitudes recorded in the presence of TTX. (Right) Representative average mEPSC traces. Scale: 10 ms, 3 pA; graph represents mean ± SEM mEPSC amplitudes. There is a small but significant decrease in mEPSC amplitude in ChR2-transfected photostimulated neurons. (D) mEPSC frequency is significantly decreased in ChR2-transfected photostimulated neurons. (Left) Representative traces. Scale: 1 s, 10 pA. (E) Synaptic failures measured during minimal stimulation experiments. (Left) Representative histograms showing distributions of noise and post-stimulus amplitudes. (Right) Quantification of synaptic failures in paired recordings; there is a significant increase in the number of synaptic failures in ChR2-transfected photostimulated neurons. (F) (Left) Example images of Alexa-dye filled apical dendrites of non-photostimulated and photostimulated ChR2-transfected neurons. Scale bar: 5 μm. (Right, top) Quantification of primary apical dendrite spine density in pairs of neurons in non-photostimulated slices. (Right, bottom) Quantification of spine density in photostimulated slices. There is a significant decrease in spine density in ChR2-transfected neurons relative to control neurons in photostimulated slices.
Figure 3
Figure 3. Synaptic Activity and Spiking Are Not Required for Photostimulation-Induced Synaptic Depression
(A) Slices were photostimulated for 24 hours in the presence of D-APV (100 μM). Scatter plots show AMPAR and NMDAR synaptic currents from ChR2-transfected and control cell pairs, as in figure 1. AMPAR, NMDAR Scales: 50 ms, 5 pA; 100 ms, 20 pA. (B) Same experiment as in (A) but including 50 μM D-APV and 20 μM NBQX in the slice media. Scales: 50 ms, 5 pA; 100 ms, 100 pA. (C) Same experiment as in (A) but including TTX (1 μM) in the slice media. Scales: 50 ms, 10 pA; 100 ms, 30 pA. (D) Summary graph of mean ± SEM EPSC amplitudes, expressed as a ratio of transfected to control neuron values. There was a significant depression of both AMPAR and NMDAR synaptic currents in ChR2-transfected photostimulated neurons in all three manipulations. Dashed lines/shaded area in this and subsequent figures represent mean ± SEM relative synaptic responses for photostimulated neurons in control conditions (repeated from figure 1).
Figure 4
Figure 4. Activation of L-Type Voltage Gated Calcium Channels Is Required for Photostimulation-Induced Synaptic Depression
(A) Slices were photostimulated for 24 hours in the presence of nickel chloride (100 μM). Scatter plots show AMPAR and NMDAR synaptic currents from ChR2-transfected and control cell pairs. Scales: 50 ms, 10 pA; 100 ms, 15 pA. (B) Same experiment as in (A) but instead including ω-conotoxin GVIA (1 μM). Scales: 50 ms, 20 pA; 100 ms, 20 pA. (C) As in (A) but including nifedipine (20 μM). Scales: 50 ms, 10 pA; 100 ms, 15 pA. (D) Summary graph. Depression of AMPAR and NMDAR currents occurred in ChR2-transfected photostimulated neurons in the presence of nickel chloride or ω-conotoxin GVIA but not nifedipine.
Figure 5
Figure 5. Transcription and Protein Translation Are Required for Photostimulation-Induced Synaptic Depression
(A) Scatter plot of synaptic currents from slices photostimulated 24 hours in the presence of cycloheximide (100 μM). Scales: 50 ms, 20 pA; 100 ms, 15 pA. (B) Summary graph of synaptic data from 5,6-dichloro 1-β D-ribobenzimidazole (DRB, 160 μM), cycloheximide (CXM), or anisomycin (ANS, 20 μM) treated slices. (C) No decrease in ChR2 expression in recorded cells after drug treatments. C1: Representative traces of light pulse-evoked currents in non drug-treated ChR2-transfected neurons (synaptic current data in Figure 1) and cycloheximide-treated ChR2-transfected neurons. Scale bar: 50 ms, 150 pA. C2: Graph shows mean ± SEM light pulse-evoked current in different conditions. See also Figure S2.
Figure 6
Figure 6. Inhibiting CaMKII Does Not Block Photostimulation-Induced Synaptic Depression
(A,B) Scatter plots showing data from slices photostimulated for 24 hours in the presence of myr-CaMKIIN or myrautocamtide-2 related inhibitory peptide (myr-AIP). Scales: (A) 50 ms, 10 pA; 100 ms; 50 pA. (B) 50 ms, 15 pA; 100 ms, 50 pA. (C) Summary graph showing significant depression of both AMPAR and NMDAR responses by photostimulation in the presence of either myr-CaMKIIN or myr-AIP. (D) Neurons treated with myristoylated-CaMKIIN (myr-CaMKIIN; 10 μM; 1–2 days) have decreased AMPA:NMDA ratios. Left, representative traces from control (top) or myr-CaMKIIN-treated (bottom) slices. Scale: 50 ms, 10 pA. (E) Synaptic responses from control- and EGFP-CaMKIIN-expressing neurons. Synaptic AMPAR responses are depressed in EGFP-CaMKIIN-expressing neurons. Scales: 50 ms, 10 pA; 100 ms, 20 pA. See also Figure S3.
Figure 7
Figure 7. Activation of CaMKK and its Downstream Target, CaMK4, Is Necessary for Photostimulation-Induced Synaptic Depression
(A) Slices were photostimulated for 24 hours in the presence of STO-609 (3 μM). Scatter plots show AMPAR and NMDAR synaptic currents from pairs of ChR2-transfected and control cell pairs. Scales: 50 ms, 20 pA; 100 ms, 15 pA. (B) Same as in (A), except ChR2-transfected cells were co-transfected with STO-609 resistant CaMKKL233F. Scales: 50 ms, 20 pA; 100 ms, 25 pA. (C) Summary graph. There is no significant depression of AMPAR and NMDAR synaptic currents in ChR2-transfected photostimulated neurons in the presence of STO-609, but there is a significant depression of AMPAR and NMDAR currents when ChR2-transfected photostimulated neurons are additionally transfected with CaMKKL233F. (D) Scatter plot showing AMPAR and NMDAR synaptic currents from pairs of control neurons and neurons cotransfected with ChR2 and CaMK4-shRNA (not photostimulated). Scales: 50 ms, 10 pA; 100 ms, 10 pA. (E) Same as in (D) except neurons were photostimulated. Scales: 50 ms, 20 pA; 100 ms, 20 pA. (F) Scatter plot of synaptic responses from control neurons and neurons expressing constitutively active CaMK4 for 2 days. Scales: 50 ms, 15 pA; 100 ms, 20 pA. (G) Neurons were double-transfected with either ChR2 and dominant-negative CaMK1 or ChR2 and dominant-negative nuclear-localized CaMK4; paired recordings of transfected/control neuron pairs were conducted from either non-photostimulated or photostimulated slices. Data from CaMK4-shRNA expressing neurons is also included. The relative amplitude of transfected/control neuron AMPAR or NMDAR synaptic currents in the different conditions is plotted. See also Figure S4.
Figure 8
Figure 8. CaMKK Depresses Synaptic Transmission During Chronic Elevated Network Activity
(A) Scatter plot of synaptic currents from pairs of CaMKKL233F-transfected versus control neurons treated for 24 hours with STO-609 (3 μM). Scales: 50 ms, 5 pA; 100 ms, 100 ms, 10 pA. (B) Same as in (A) except slices were treated for 24 hours with both STO-609 and gabazine (10 μM). Scales: 50 ms, 25 pA; 100 ms, 15 pA. (C) Same as in (A) except slices were treated with STO-609, gabazine, and nifedipine (20 μM). Scales: 50 ms, 15 pA; 100 ms, 20 pA. (D) Same as in (A) except slices were treated with gabazine alone. Scales: 50 ms, 10 pA; 100 ms, 30 pA. (E) Summary graph. See also Figure S5.
Figure 9
Figure 9. Photostimulation-Induced Synaptic Depression Requires the GluA2 AMPAR Subunit
(A–C) Scatter plots show AMPAR and NMDAR synaptic currents from pairs of ChR2-transfected versus control neurons photostimulated 24 hours, from wildtype, GluA1 (gria1) knockout, and GluA2 (gria2) knockout mice, respectively. There is a significant depression of synaptic currents for photostimulated versus control cells in all conditions except AMPAR responses in the GluA2 knockout. Scales: (A) 50 ms, 40 pA; 100 ms, 25 pA. (B) 50 ms, 20 pA; 100 ms, 30 pA. (C) 50 ms, 20 pA; 100 ms, 30 pA. (D) Summary graph of data in A–C. (E) Left: AMPAR responses measured in the presence of D-APV at −70, 0 and +40 mV in control and photostimulated neurons. Scale: 50 ms, 50 pA. There is no significant change in rectification index, the ratio of responses at +40 mV and −70 mV, between control and ChR2-transfected, photostimulated neurons. (F) Glutamate-evoked AMPAR currents in somatic outside-out patches from control and ChR2-transfected, photostimulated neurons. There is a significant increase in current amplitude in patches from ChR2-transfected neurons. Scale: 1 s, 100 pA.

Comment in

Similar articles

Cited by

References

    1. Ageta-Ishihara N, Takemoto-Kimura S, Nonaka M, Adachi-Morishima A, Suzuki K, Kamijo S, Fujii H, Mano T, Blaeser F, Chatila TA, et al. Control of cortical axon elongation by a GABA-driven Ca2+/Calmodulin-dependent protein kinase cascade. J. Neurosci. 2009;29:13720–13729. - PMC - PubMed
    1. Ahmed OJ, Mehta MR. The hippocampal rate code: anatomy, physiology and theory. Trends Neurosci. 2009;32:329–338. - PMC - PubMed
    1. Aoto J, Nam CI, Poon MM, Ting P, Chen L. Synaptic signaling by all-trans retinoic acid in homeostatic synaptic plasticity. Neuron. 2008;60:308–320. - PMC - PubMed
    1. Bellone C, Nicoll RA. Rapid bidirectional switching of synaptic NMDA receptors. Neuron. 2007;55:779–785. - PubMed
    1. Boyden ES, Zhang F, Bamberg E, Nagel G, Deisseroth K. Millisecond-timescale, genetically targeted optical control of neural activity. Nat. Neurosci. 2005;8:1263–1268. - PubMed

Publication types

MeSH terms

Substances