

Filtering of visual information in the tectum by an identified neural circuit
- PMID: 21030657
- PMCID: PMC3243732
- DOI: 10.1126/science.1192949
Filtering of visual information in the tectum by an identified neural circuit
Abstract
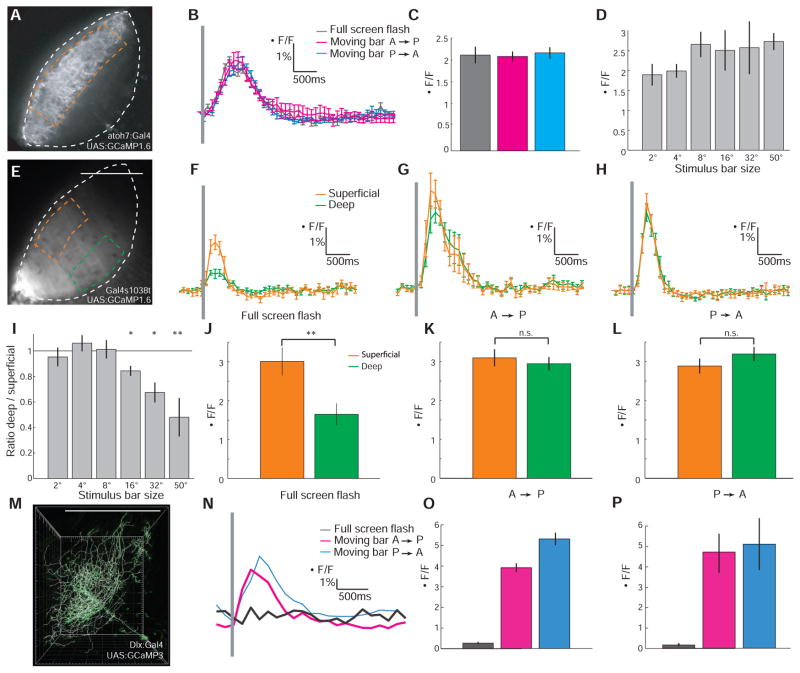
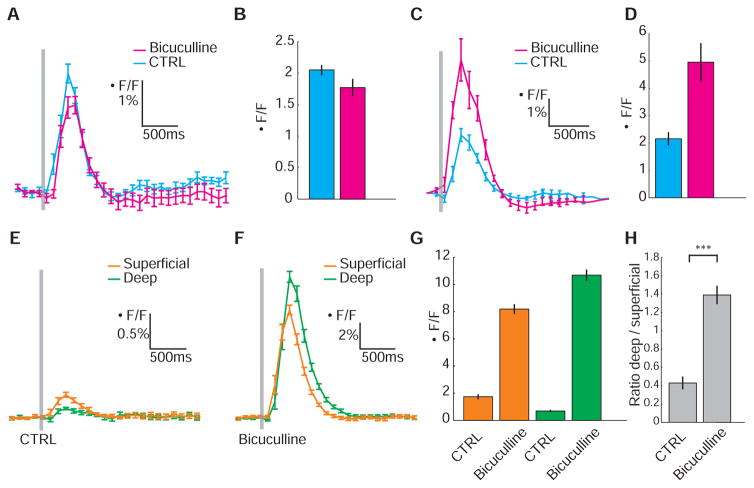
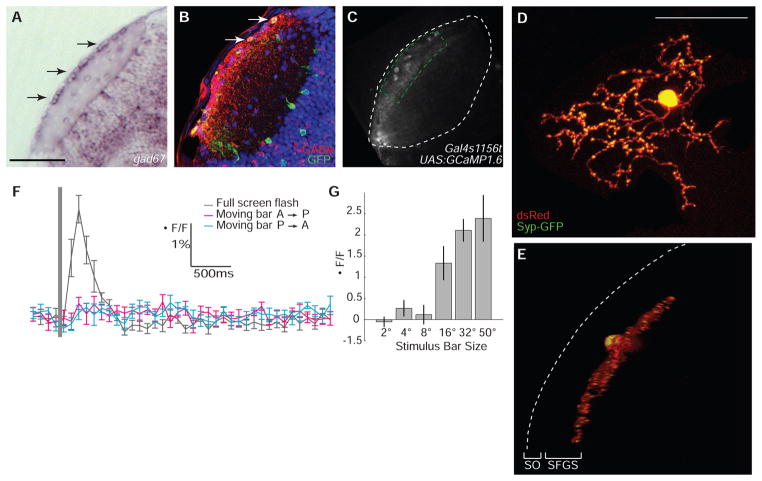
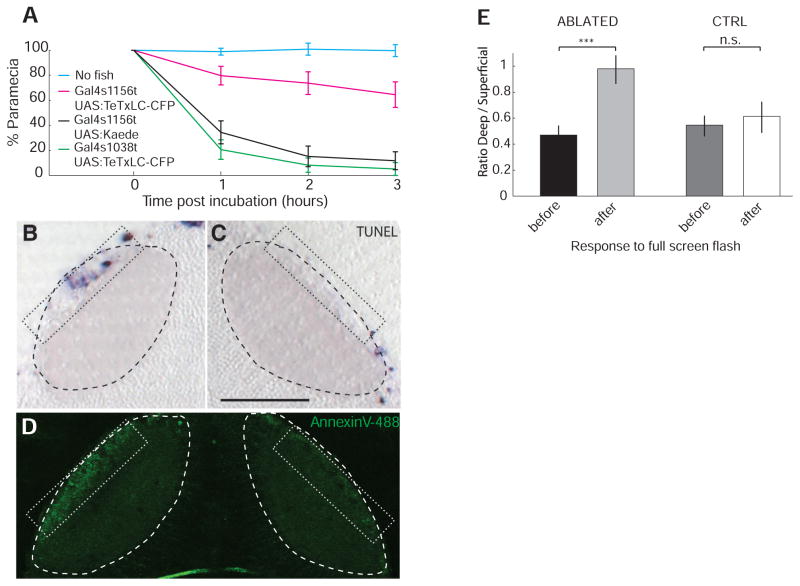
The optic tectum of zebrafish is involved in behavioral responses that require the detection of small objects. The superficial layers of the tectal neuropil receive input from retinal axons, while its deeper layers convey the processed information to premotor areas. Imaging with a genetically encoded calcium indicator revealed that the deep layers, as well as the dendrites of single tectal neurons, are preferentially activated by small visual stimuli. This spatial filtering relies on GABAergic interneurons (using the neurotransmitter γ-aminobutyric acid) that are located in the superficial input layer and respond only to large visual stimuli. Photo-ablation of these cells with KillerRed, or silencing of their synaptic transmission, eliminates the size tuning of deeper layers and impairs the capture of prey.
Figures
Similar articles
-
Organization of local interneurons in optic glomeruli of the dipterous visual system and comparisons with the antennal lobes.Dev Neurobiol. 2007 Sep 1;67(10):1267-88. doi: 10.1002/dneu.20396. Dev Neurobiol. 2007. PMID: 17638381
-
Classification of object size in retinotectal microcircuits.Curr Biol. 2014 Oct 20;24(20):2376-85. doi: 10.1016/j.cub.2014.09.012. Epub 2014 Sep 18. Curr Biol. 2014. PMID: 25242030
-
Inhibitory mechanism in zebrafish optic tectum: visual response properties of tectal cells altered by picrotoxin and bicuculline.Brain Res. 1983 Jul 25;271(2):227-40. doi: 10.1016/0006-8993(83)90285-8. Brain Res. 1983. PMID: 6616176
-
SINs and SOMs: neural microcircuits for size tuning in the zebrafish and mouse visual pathway.Front Neural Circuits. 2013 May 10;7:89. doi: 10.3389/fncir.2013.00089. eCollection 2013. Front Neural Circuits. 2013. PMID: 23717263 Free PMC article. Review.
-
Direction selectivity in the visual system of the zebrafish larva.Front Neural Circuits. 2013 Jun 18;7:111. doi: 10.3389/fncir.2013.00111. eCollection 2013. Front Neural Circuits. 2013. PMID: 23785314 Free PMC article. Review.
Cited by
-
Spontaneous and evoked activity patterns diverge over development.Elife. 2021 Apr 19;10:e61942. doi: 10.7554/eLife.61942. Elife. 2021. PMID: 33871351 Free PMC article.
-
Prey capture in zebrafish larvae serves as a model to study cognitive functions.Front Neural Circuits. 2013 Jun 11;7:110. doi: 10.3389/fncir.2013.00110. eCollection 2013. Front Neural Circuits. 2013. PMID: 23781176 Free PMC article. Review.
-
Deletion of a kinesin I motor unmasks a mechanism of homeostatic branching control by neurotrophin-3.Elife. 2015 Jun 15;4:e05061. doi: 10.7554/eLife.05061. Elife. 2015. PMID: 26076409 Free PMC article.
-
Precise lamination of retinal axons generates multiple parallel input pathways in the tectum.J Neurosci. 2013 Mar 13;33(11):5027-39. doi: 10.1523/JNEUROSCI.4990-12.2013. J Neurosci. 2013. PMID: 23486973 Free PMC article.
-
From perception to behavior: The neural circuits underlying prey hunting in larval zebrafish.Front Neural Circuits. 2023 Feb 1;17:1087993. doi: 10.3389/fncir.2023.1087993. eCollection 2023. Front Neural Circuits. 2023. PMID: 36817645 Free PMC article. Review.
References
Publication types
MeSH terms
Substances
Grants and funding
- R01 EY012406/EY/NEI NIH HHS/United States
- R01 NS053358-01A2/NS/NINDS NIH HHS/United States
- R01 NS053358/NS/NINDS NIH HHS/United States
- R01 EY012406-06A2/EY/NEI NIH HHS/United States
- R01 EY012406-09/EY/NEI NIH HHS/United States
- R01 NS053358-04/NS/NINDS NIH HHS/United States
- R01 NS053358-02/NS/NINDS NIH HHS/United States
- R01 EY012406-08/EY/NEI NIH HHS/United States
- HHMI/Howard Hughes Medical Institute/United States
- PN2 EY018241/EY/NEI NIH HHS/United States
- R01 MH060711/MH/NIMH NIH HHS/United States
- R01 NS053358-03/NS/NINDS NIH HHS/United States
- R01 NS050833/NS/NINDS NIH HHS/United States
- R01 NS053358-02S1/NS/NINDS NIH HHS/United States
- R01 EY012406-07/EY/NEI NIH HHS/United States
LinkOut - more resources
Full Text Sources
Other Literature Sources
Molecular Biology Databases
Research Materials
