

Software for the high-throughput collection of SAXS data using an enhanced Blu-Ice/DCS control system
- PMID: 20975223
- PMCID: PMC2964114
- DOI: 10.1107/S0909049510028566
Software for the high-throughput collection of SAXS data using an enhanced Blu-Ice/DCS control system
Abstract
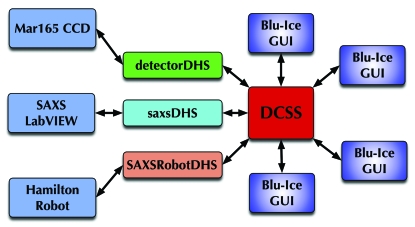
Biological small-angle X-ray scattering (SAXS) provides powerful complementary data for macromolecular crystallography (MX) by defining shape, conformation and assembly in solution. Although SAXS is in principle the highest throughput technique for structural biology, data collection is limited in practice by current data collection software. Here the adaption of beamline control software, historically developed for MX beamlines, for the efficient operation and high-throughput data collection at synchrotron SAXS beamlines is reported. The Blu-Ice GUI and Distributed Control System (DCS) developed in the Macromolecular Crystallography Group at the Stanford Synchrotron Radiation Laboratory has been optimized, extended and enhanced to suit the specific needs of the biological SAXS endstation at the SIBYLS beamline at the Advanced Light Source. The customizations reported here provide a potential route for other SAXS beamlines in need of robust and efficient beamline control software. As a great deal of effort and optimization has gone into crystallographic software, the adaption and extension of crystallographic software may prove to be a general strategy to provide advanced SAXS software for the synchrotron community. In this way effort can be put into optimizing features for SAXS rather than reproducing those that have already been successfully implemented for the crystallographic community.
Figures


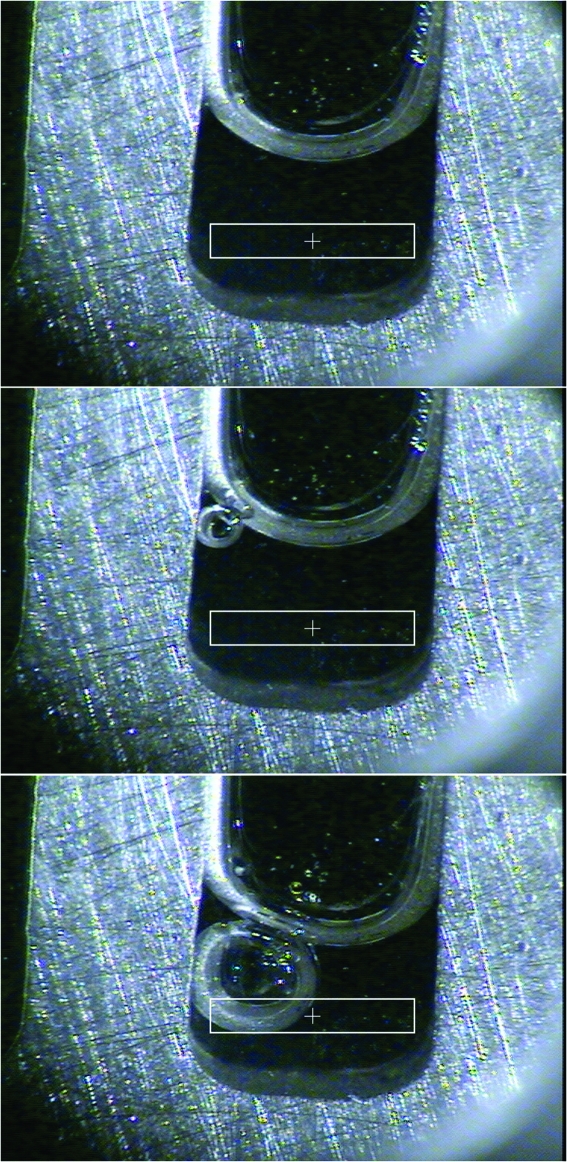
 ≃ 400). The bottom image shows an example of a bubble that would be very problematic for collecting high-quality SAXS data (
 ≃ 2000).
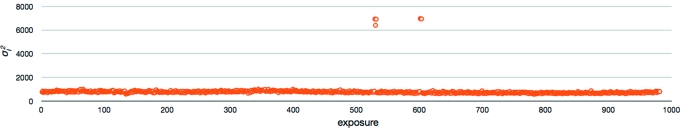
 ) over a 24 h period during which time 980 exposures were collected. During the collection there was one sample, beginning at exposure #533, that contained multiple bubbles in the ROI and a second sample, beginning at exposure #602, that was incompletely loaded with the meniscus located within the ROI.
Similar articles
-
Implementation and performance of SIBYLS: a dual endstation small-angle X-ray scattering and macromolecular crystallography beamline at the Advanced Light Source.J Appl Crystallogr. 2013 Feb 1;46(Pt 1):1-13. doi: 10.1107/S0021889812048698. Epub 2013 Jan 17. J Appl Crystallogr. 2013. PMID: 23396808 Free PMC article.
-
Blu-Ice and the Distributed Control System: software for data acquisition and instrument control at macromolecular crystallography beamlines.J Synchrotron Radiat. 2002 Nov 1;9(Pt 6):401-6. doi: 10.1107/s0909049502015170. Epub 2002 Nov 1. J Synchrotron Radiat. 2002. PMID: 12409628
-
High-throughput SAXS for the characterization of biomolecules in solution: a practical approach.Methods Mol Biol. 2014;1091:245-58. doi: 10.1007/978-1-62703-691-7_18. Methods Mol Biol. 2014. PMID: 24203338 Free PMC article.
-
Automation of macromolecular crystallography beamlines.Prog Biophys Mol Biol. 2005 Oct;89(2):124-52. doi: 10.1016/j.pbiomolbio.2004.09.003. Prog Biophys Mol Biol. 2005. PMID: 15910915 Review.
-
Application of in situ diffraction in high-throughput structure determination platforms.Methods Mol Biol. 2015;1261:233-53. doi: 10.1007/978-1-4939-2230-7_13. Methods Mol Biol. 2015. PMID: 25502203 Review.
Cited by
-
A new structural framework for integrating replication protein A into DNA processing machinery.Nucleic Acids Res. 2013 Feb 1;41(4):2313-27. doi: 10.1093/nar/gks1332. Epub 2013 Jan 8. Nucleic Acids Res. 2013. PMID: 23303776 Free PMC article.
-
Allosteric activation of the nitric oxide receptor soluble guanylate cyclase mapped by cryo-electron microscopy.Elife. 2019 Sep 30;8:e50634. doi: 10.7554/eLife.50634. Elife. 2019. PMID: 31566566 Free PMC article.
-
Exploring the repeat protein universe through computational protein design.Nature. 2015 Dec 24;528(7583):580-4. doi: 10.1038/nature16162. Epub 2015 Dec 16. Nature. 2015. PMID: 26675729 Free PMC article.
-
Implementation and performance of SIBYLS: a dual endstation small-angle X-ray scattering and macromolecular crystallography beamline at the Advanced Light Source.J Appl Crystallogr. 2013 Feb 1;46(Pt 1):1-13. doi: 10.1107/S0021889812048698. Epub 2013 Jan 17. J Appl Crystallogr. 2013. PMID: 23396808 Free PMC article.
-
Designing and defining dynamic protein cage nanoassemblies in solution.Sci Adv. 2016 Dec 14;2(12):e1501855. doi: 10.1126/sciadv.1501855. eCollection 2016 Dec. Sci Adv. 2016. PMID: 27990489 Free PMC article.
References
-
- Arvai, A. (2009). ADXV – a program to display X-ray diffraction images, http://www.scripps.edu/~arvai/adxv.html.
-
- David, G. & Pérez, J. (2009). J. Appl. Cryst.42, 892–900.
-
- Gauch, J. M. (2009). KUIM Image Processing System. Kansas University, USA.
Publication types
MeSH terms
Grants and funding
LinkOut - more resources
Full Text Sources
Research Materials
Miscellaneous
