

Peroxisome-generated hydrogen peroxide as important mediator of lipotoxicity in insulin-producing cells
- PMID: 20971967
- PMCID: PMC3012172
- DOI: 10.2337/db09-1401
Peroxisome-generated hydrogen peroxide as important mediator of lipotoxicity in insulin-producing cells
Abstract
Objective: Type 2 diabetes is a complex disease that is accompanied by elevated levels of nonesterified fatty acids (NEFAs), which contribute to β-cell dysfunction and β-cell loss, referred to as lipotoxicity. Experimental evidence suggests that oxidative stress is involved in lipotoxicity. In this study, we analyzed the molecular mechanisms of reactive oxygen species-mediated lipotoxicity in insulin-producing RINm5F cells and INS-1E cells as well as in primary rat islet cells.
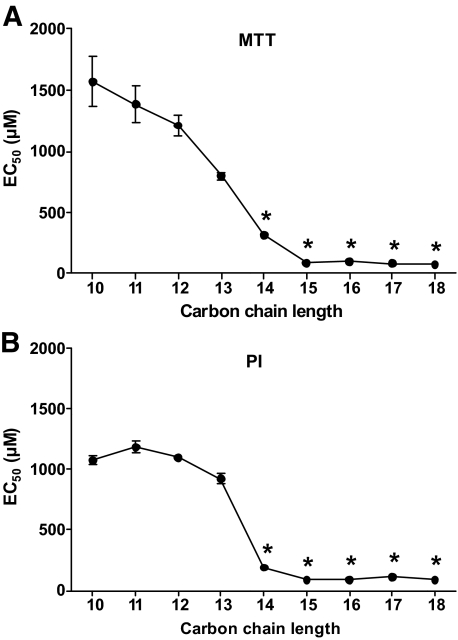
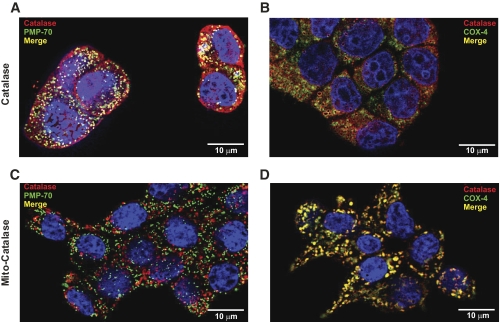
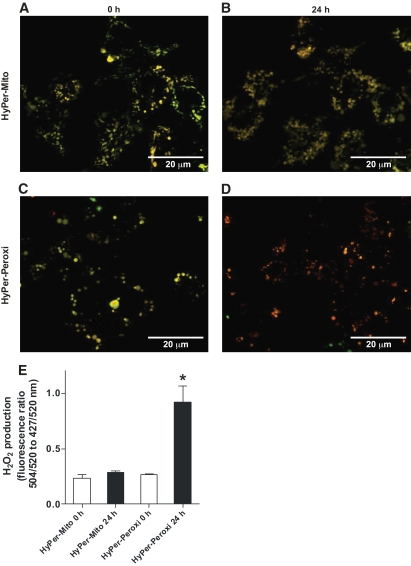
Research design and methods: The toxicity of saturated NEFAs with different chain lengths upon insulin-producing cells was determined by MTT and propidium iodide (PI) viability assays. Catalase or superoxide dismutase overexpressing cells were used to analyze the nature and the cellular compartment of reactive oxygen species formation. With the new H₂O₂-sensitive fluorescent protein HyPer H₂O₂ formation induced by exposure to palmitic acid was determined.
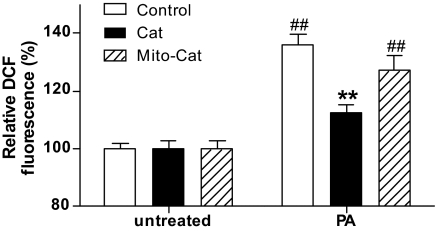
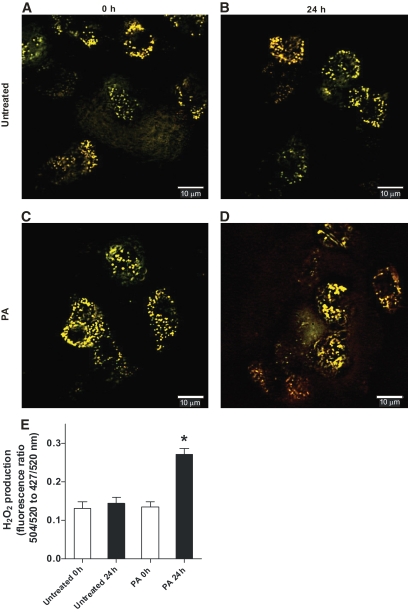
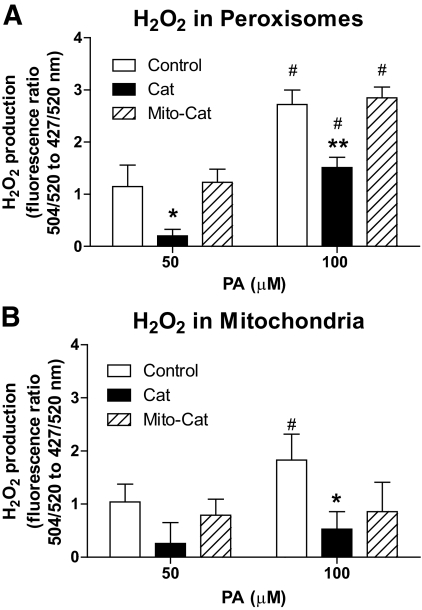
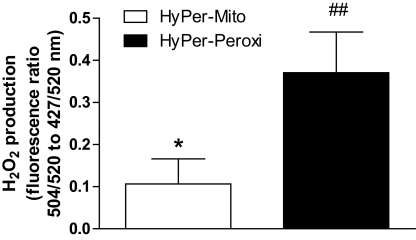
Results: Only long-chain (>C14) saturated NEFAs were toxic to insulin-producing cells. Overexpression of catalase in the peroxisomes and in the cytosol, but not in the mitochondria, significantly reduced H₂O₂ formation and protected the cells against palmitic acid-induced toxicity. With the HyPer protein, H₂O₂ generation was directly detectable in the peroxisomes of RINm5F and INS-1E insulin-producing cells as well as in primary rat islet cells.
Conclusions: The results demonstrate that H₂O₂ formation in the peroxisomes rather than in the mitochondria are responsible for NEFA-induced toxicity. Therefore, we propose a new concept of fatty acid-induced β-cell lipotoxicity mediated via reactive oxygen species formation through peroxisomal β- oxidation.
Figures

Similar articles
-
Antagonism Between Saturated and Unsaturated Fatty Acids in ROS Mediated Lipotoxicity in Rat Insulin-Producing Cells.Cell Physiol Biochem. 2015;36(3):852-65. doi: 10.1159/000430261. Epub 2015 May 27. Cell Physiol Biochem. 2015. PMID: 26044490
-
The role of lipid droplet formation in the protection of unsaturated fatty acids against palmitic acid induced lipotoxicity to rat insulin-producing cells.Nutr Metab (Lond). 2016 Feb 25;13:16. doi: 10.1186/s12986-016-0076-z. eCollection 2016. Nutr Metab (Lond). 2016. PMID: 26918025 Free PMC article.
-
Role of metabolically generated reactive oxygen species for lipotoxicity in pancreatic β-cells.Diabetes Obes Metab. 2010 Oct;12 Suppl 2:149-58. doi: 10.1111/j.1463-1326.2010.01265.x. Diabetes Obes Metab. 2010. PMID: 21029312 Review.
-
Oleic acid protects insulin-secreting INS-1E cells against palmitic acid-induced lipotoxicity along with an amelioration of ER stress.Endocrine. 2019 Jun;64(3):512-524. doi: 10.1007/s12020-019-01867-3. Epub 2019 Feb 18. Endocrine. 2019. PMID: 30778898
-
Nutrient Metabolism, Subcellular Redox State, and Oxidative Stress in Pancreatic Islets and β-Cells.J Mol Biol. 2020 Mar 6;432(5):1461-1493. doi: 10.1016/j.jmb.2019.10.012. Epub 2019 Oct 18. J Mol Biol. 2020. PMID: 31634466 Review.
Cited by
-
Autocrine C-peptide protects INS1 β cells against palmitic acid-induced oxidative stress in peroxisomes by inducing catalase.Endocrinol Diabetes Metab. 2020 May 30;3(3):e00147. doi: 10.1002/edm2.147. eCollection 2020 Jul. Endocrinol Diabetes Metab. 2020. PMID: 32704568 Free PMC article.
-
Evidence-based pathogenesis and treatment of ulcerative colitis: A causal role for colonic epithelial hydrogen peroxide.World J Gastroenterol. 2022 Aug 21;28(31):4263-4298. doi: 10.3748/wjg.v28.i31.4263. World J Gastroenterol. 2022. PMID: 36159014 Free PMC article. Review.
-
Western Diet Causes Obesity-Induced Nonalcoholic Fatty Liver Disease Development by Differentially Compromising the Autophagic Response.Antioxidants (Basel). 2020 Oct 15;9(10):995. doi: 10.3390/antiox9100995. Antioxidants (Basel). 2020. PMID: 33076261 Free PMC article.
-
Peroxisome degradation in mammals: mechanisms of action, recent advances, and perspectives.Front Physiol. 2013 Jun 14;4:145. doi: 10.3389/fphys.2013.00145. eCollection 2013. Front Physiol. 2013. PMID: 23785334 Free PMC article.
-
Regulation of Pdx1 by oxidative stress and Nrf2 in pancreatic beta-cells.Front Endocrinol (Lausanne). 2022 Sep 15;13:1011187. doi: 10.3389/fendo.2022.1011187. eCollection 2022. Front Endocrinol (Lausanne). 2022. PMID: 36187092 Free PMC article. Review.
References
-
- Boden G: Role of fatty acids in the pathogenesis of insulin resistance and NIDDM. Diabetes 1997;46:3–10 - PubMed
-
- DeFronzo RA: Lilly lecture 1987. The triumvirate: β-cell, muscle, liver. A collusion responsible for NIDDM. Diabetes 1988;37:667–687 - PubMed
-
- Carpentier A, Mittelman SD, Lamarche B, Bergman RN, Giacca A, Lewis GF: Acute enhancement of insulin secretion by FFA in humans is lost with prolonged FFA elevation. Am J Physiol 1999;276:E1055–E1066 - PubMed
-
- Kashyap S, Belfort R, Gastaldelli A, Pratipanawatr T, Berria R, Pratipanawatr W, Bajaj M, Mandarino L, DeFronzo R, Cusi K: A sustained increase in plasma free fatty acids impairs insulin secretion in nondiabetic subjects genetically predisposed to develop type 2 diabetes. Diabetes 2003;52:2461–2474 - PubMed
-
- Paolisso G, Gambardella A, Amato L, Tortoriello R, D'Amore A, Varricchio M, D'Onofrio F: Opposite effects of short- and long-term fatty acid infusion on insulin secretion in healthy subjects. Diabetologia 1995;38:1295–1299 - PubMed
Publication types
MeSH terms
Substances
LinkOut - more resources
Full Text Sources
Research Materials
Miscellaneous
