. 2010 Oct 5;8(10):e1000502.
doi: 10.1371/journal.pbio.1000502.

An integrated micro- and macroarchitectural analysis of the Drosophila brain by computer-assisted serial section electron microscopy

Affiliations

An integrated micro- and macroarchitectural analysis of the Drosophila brain by computer-assisted serial section electron microscopy

Albert Cardona et al. PLoS Biol. .

Abstract

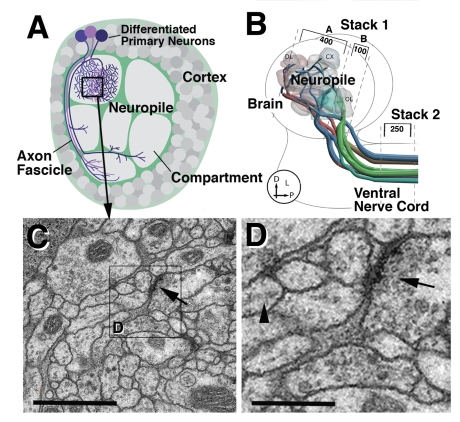
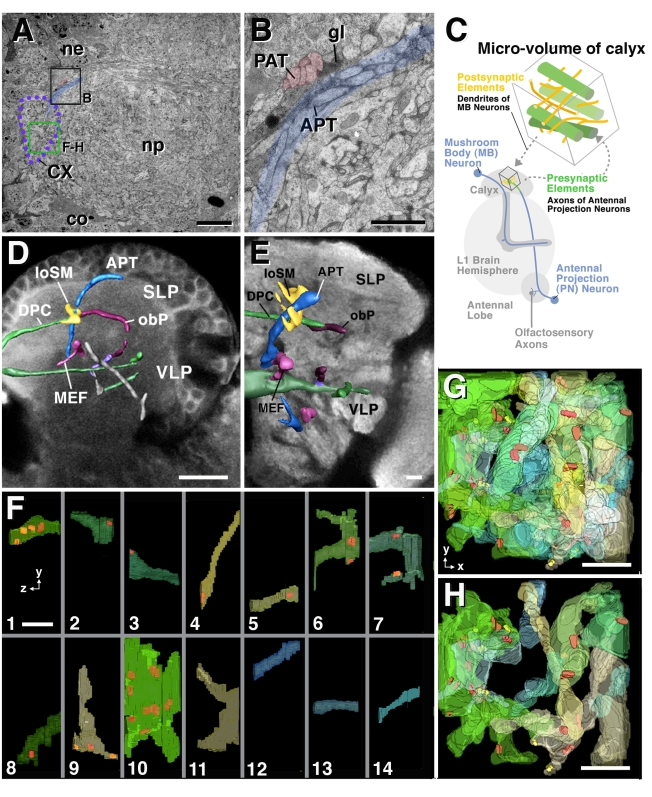
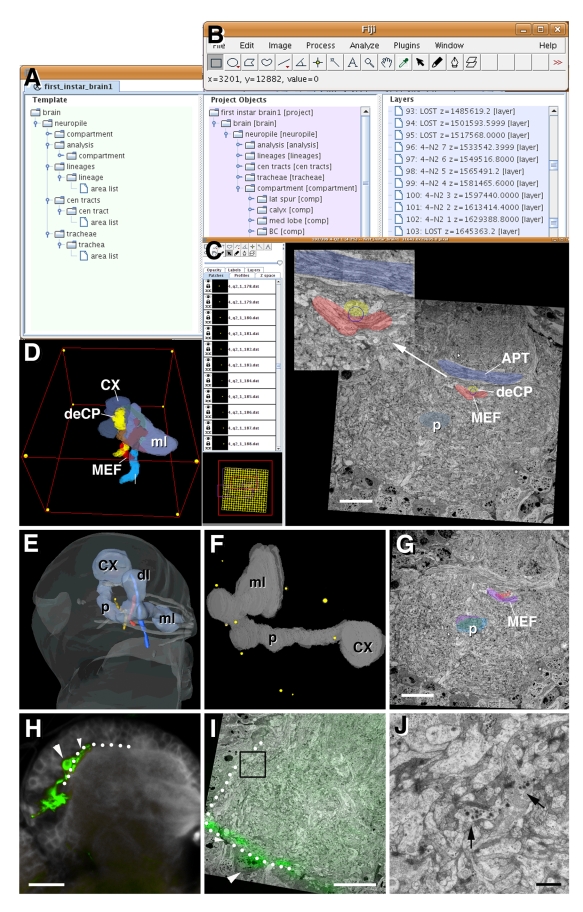
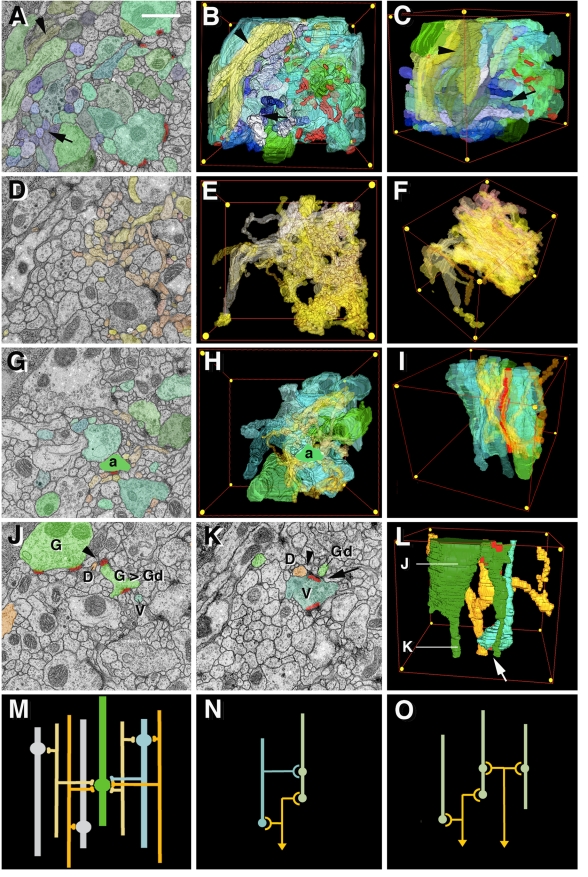
The analysis of microcircuitry (the connectivity at the level of individual neuronal processes and synapses), which is indispensable for our understanding of brain function, is based on serial transmission electron microscopy (TEM) or one of its modern variants. Due to technical limitations, most previous studies that used serial TEM recorded relatively small stacks of individual neurons. As a result, our knowledge of microcircuitry in any nervous system is very limited. We applied the software package TrakEM2 to reconstruct neuronal microcircuitry from TEM sections of a small brain, the early larval brain of Drosophila melanogaster. TrakEM2 enables us to embed the analysis of the TEM image volumes at the microcircuit level into a light microscopically derived neuro-anatomical framework, by registering confocal stacks containing sparsely labeled neural structures with the TEM image volume. We imaged two sets of serial TEM sections of the Drosophila first instar larval brain neuropile and one ventral nerve cord segment, and here report our first results pertaining to Drosophila brain microcircuitry. Terminal neurites fall into a small number of generic classes termed globular, varicose, axiform, and dendritiform. Globular and varicose neurites have large diameter segments that carry almost exclusively presynaptic sites. Dendritiform neurites are thin, highly branched processes that are almost exclusively postsynaptic. Due to the high branching density of dendritiform fibers and the fact that synapses are polyadic, neurites are highly interconnected even within small neuropile volumes. We describe the network motifs most frequently encountered in the Drosophila neuropile. Our study introduces an approach towards a comprehensive anatomical reconstruction of neuronal microcircuitry and delivers microcircuitry comparisons between vertebrate and insect neuropile.


Conflict of interest statement

The authors have declared that no competing interests exist.

Figures

Figure 1
Figure 1. Drosophila first instar larval brain.
(A) Schematic depiction of cross-section of one brain hemisphere, showing outer cortex of neuronal cell bodies in central neuropile, formed by neuronal processes (neurites). One lineage of primary neurons is highlighted in purple color. Processes of glial cells (green) surround the cortex and neuropile and form boundaries around compartments within the neuropile. (B) Schematic of larval brain and ventral nerve cord, indicating positioning and orientation of serial sections. The first stack contains the neuropile of one brain hemisphere in two closely adjacent sets of 400 and 100 sections, respectively. The second stack includes 250 sections of the ventral nerve cord (corresponding to approximately two consecutive neuromeres). Colored lines represent axon tracts connecting brain and ventral nerve cord (after 69). (C, D) Electron micrographs of sections of neuropile illustrating resolution that can be achieved at 5,000× primary magnification. Arrow in (C) points at synapse; arrow in (D) indicates presynaptic vesicles; arrowhead shows obliquely sectioned microtubule. At a resolution of 4 nm per pixel, these structures can be clearly resolved. Scale bars: 1 µm (C); 350 nm (D).
Figure 2
Figure 2. Microvolumes and neuropile landmarks.
(A, B) Montage of electron micrographs of representative brain section (A; co, cortex; ne, neuronal cell body; np, neuropile). Note that this and all other electron microscopic images of the figures presented in this article are a composite of multiple tiled digital photographs stitched together with the TrakEM2 software, as explained in Materials and Methods. Occasional slight discontinuities in image brightness (as for example at lower right corner of panel A) correspond to borders of tiles. Bundles of long axons can be recognized and identified with specific, lineage-related fascicles known from confocal microscopy. Upper boxed area, shown at higher magnification in panel B, contains branch of antenno-cerebral tract (APT; blue) and adjacent axon tract formed by one of the DPM lineages (PAT). Note glial processes (gl) accompanying axon fascicles. Green box in (A) demarcates size and position of a microvolume that was cropped out of stack for further analysis (see panels F–H). Dotted purple line demarcates calyx (CX) compartment. (C) Schematic drawing showing L1 brain hemisphere with circuit consisting of antennal lobe-calyx-spur/lobes of mushroom body. Fascicles forming this circuit (e.g., APT, mushroom body) can be identified in TEM stack and help to interpret short segments of neurites contained within microvolumes (e.g., microvolume from within the calyx). (D, E) Confocal cross-sections of first instar larval brain hemisphere (D) and adult brain hemisphere (E) labeled with anti-Brp to visualize neuropile. Set of lineage-related axon fascicles that can be followed from first instar to adult are rendered in different colors. These fascicles (among them the APT shown in panels A, B) form a system of invariant landmarks that can be recognized in confocal stacks and TEM stacks. Abbreviations: APT, antenno-protocerebral tract; DPC, dorso-posterior commissure; loSM, longitudinal superior-medial fascicle; MEF, medial equatorial fascicle; obP, oblique posterior fascicle; SLP, superior lateral protocerebrum; VLP, ventro-lateral protocerebrum. (F–H) 3D views of selected objects within the calyx microvolume. Microvolume contained 42 large diameter (>0.2 µm) neurite segments. Of these, 14 were randomly picked and are shown individually in panels F1–F14 (volume in side view; y and z indicate direction of axes of volume). (G, H) Top view of large diameter neurite segments combined (G: all 42 segments; H: 14 segments shown individually in panel F). Red dots indicate position of presynaptic sites. Scale bars: 4 µm (A); 0.5 µm (B); 10 µm (C, D); 1 µm (F, G, H).
Figure 3
Figure 3. The graphical user interface of TrakEM2.
(A) The object hierarchy window displays segmentation data types (left column, green), all segmented objects captured with these types (center column, magenta), and all layers along the z-axis (right column, blue). (B) ImageJ tool box. (C) The 2D canvas presents the TEM (or any other) raw data stack. The user can scroll and navigate through all sections displayed in this window. The yellow grid at bottom left of panel shows all of the image tiles that constitute the montage of the section shown. When zoomed in, a red frame indicates the area shown on canvas; by dragging the red frame, the user can navigate to the desired parts of the montage. Segmentation and annotation of identified structures (e.g., compartments and lineage tracts) is performed in the 2D canvas window. Shown are outlines of four identified axon fascicle (APT, antenno-protocerebral tract, blue; deCP, descending central protocerebral fascicle, yellow; MEF, medial equatorial fascicle, red; p, peduncle of mushroom body, light blue). Points of intersections of fascicles, such as the one between deCP and MEF (blue circle), serve as fiduciary marks with which different stacks are registered. (D) The interactive 3D viewer windows show selected objects segmented from the TEM stack. Shown as examples are the same elements depicted as sections in panel C [mushroom body (CX, calyx; ml, medial lobe), MEF fascicle, deCP fascicle]. (E–J) Registration of confocal stack to TEM stack. (E) 3D digital model of larval brain hemisphere derived from confocal stack. Shown are brain surface (light gray), mushroom body (light blue), and axon fascicles (dark gray). Set of fascicles highlighted in TEM stack (see panels C, D) are shown in corresponding colors. (F) 3D digital model of mushroom body, showing location of fiduciary marks (yellow) identified in both TEM stack and confocal stack. (G) Representative section of TEM stack. Shaded in purple are profiles of two axon fascicles (p, peduncle; MEF, medial equatorial fascicle) as they appear in the TEM section. Superimposed in red and blue are profiles of corresponding fascicles from confocal stack that was registered with TEM stack (using fiduciary marks shown in F) and digitally re-sliced along the plane of sectioning of the TEM stack. Note high degree of overlap between TEM profiles and “imported” confocal profiles. (H) Representative section of confocal stack of one brain hemisphere. Shown in green are GFP-labeled PDF neurons. The cell bodies of these neurons are located in the dorso-lateral cortex; axons form bundle that extends along the dorso-lateral cortex-neuropile boundary (white dotted line). Large arrowhead points at one cell body, small arrowhead at axon. (I) Section of registered, re-sliced confocal stack projected upon corresponding EM section. Cell body and axon are indicated by large and small arrowhead, respectively; boundary between dorso-lateral cortex and neuropile is shown as white dotted line. (J) Magnified view of area boxed in (I). Arrows point at profiles of neurites containing (neuro-secretory) dense-core vesicles. Based on their proximity to the position of PDF neurons, it is probable that these profiles correspond to branches of PDF neurites. Scale bars: 5 µm (C, G, I); 10 µm (H); 1 µm (J).
Figure 4
Figure 4. Drosophila neuropile ultrastructure.
(A–C) Generic types of neurites (globular/varicose, axiform, dendritiform) encountered in all regions of the neuropile. Upper panels of columns A, B, C show schematic representations of these neurites; lower panels show 3D digital models of representative neurite segments for corresponding classes, segmented from VNC microvolume (G1, globular neurite; V1, V2, varicose neurites; A1-3, axiform neurites; D1-3, dendritiform neurites). Elements are shown in lateral view; arrows indicate orientation (ant, anterior; dor, dorsal) relative to body axes. Red dots indicate position of presynaptic sites. (D) 3D digital model of all neurite segments shown in (A–C) as they are situated in VNC microvolume. Volume is shown in dorso-posterior view; arrows indicate axes (ant, anterior; dor, dorsal; lat, lateral). (E) Correlation between frequency of presynaptic and postsynaptic sites and neurite diameter. Presynaptic sites (blue; right) are predominantly found on large diameter profiles, which correspond to thick segments of varicose and globular neurites. Postsynaptic profiles (yellow, left) almost exclusively belong to thin dendritiform neurites. (F, G) Sections of two typical polyadic synapses. Green dots indicate presynaptic profile, characterized by T-bar (synaptic ribbon) and synaptic vesicles. Presynapses are contacted by multiple, thin branches of dendritiform processes. (H–J) Representative EM sections of VNC microvolume at three different levels along the antero-posterior-axis; levels are indicated by gray lines in panel A. Profiles of neurites shown in (A–D) are shaded in the corresponding colors and identified by the corresponding annotations (G1, V1-2, A1-3, D1-3). Scale bars: 0.1 µm (F, G); 1 µm (H–J).
Figure 5
Figure 5. Network motifs encountered in VNC microvolume.
(A–F) Structure of the VNC microvolume. (A) Representative section of VNC stack; profiles of all globular, varicose, and axiform neurites are tinted in shades of green and blue. (B, C) 3D digital model of these processes (B: frontal view; C: fronto-lateral view; red lines in these and other panels show edges of VNC microvolume; yellow dots indicate corner points). Note bundle formed by axiform neurites (arrow in A–C); another bundle of preterminal axons (light green; arrowhead) enters the microvolume from ventro-lateral. Presynaptic sites are colored red. (D) Representative section of VNC microvolume; dendritiform neurites are colored in shades of yellow and brown. (E, F) 3D digital model of all dendritiform processes in frontal view (E) and fronto-lateral view (F). (G–I) Dense overlapping regulon motif. One “primary” presynaptic neurite (“a”; bright green) contacts 12 postsynaptic dendritiform neurites (yellow-brown) at three synapses. Seven other “secondary” presynaptic elements (transparent green) are also presynaptic to these dendrites. Panel G shows representative section in which elements forming part of this motif are shaded; (H) and (I) represent 3D digital models of these elements in frontal view (H) and lateral view (I). In (I), the “primary” axonal element is colored red for better visibility. (J–L) Feed forward motif. The globular neurite (G) has thin branch (Gd) that is postsynaptic to varicose neurite segment (V; arrow in K, L). The dendritiform neurite (D) shown in orange is postsynaptic to both G (arrowhead in J) and V (arrowhead in K). Panels J and K are representative sections of VNC cube where elements of the feed forward motif are highlighted; (L) shows 3D model of motif in lateral view; levels of sections shown in (J) and (K) are indicated. (M) Schematic representation of connectivity encountered in VNC microvolume. (N, O) Schematic representation of feed forward motif and dense overlapping regulon motif, respectively. Scale bar: 1 µm (A, D, G, J, K).
Figure 6
Figure 6. Correlation between spatial overlap of neurite segments and probability of synaptic contacts in VNC microvolume.
Panels A–D show 3D digital models of elements of VNC microvolume (frontal view). All dendritiform neurites are rendered in transparent shades of yellow-brown. In panel A, one axiform neurite (a) and two dendritiform neurites (d1, d2) are rendered in solid colors. Red frames delineate boundaries of envelope surrounding the three profiles. In this example, envelope of d1 and a overlap slightly (less than 10% of volume of envelope of a is shared with envelope of d1); envelope of d2 and a overlap strongly (greater than 50% of volume of envelope of a is shared with envelope of d2). In each one of panels B–D, one varicose neurite (a) is rendered in solid green or blue; the postsynaptic dendritiform neurites that actually form synaptic contacts with the varicose neurite are rendered in solid colors (yellow-brown). Note tight clustering of denritiform neurites around the corresponding varicose element. (E) Histogram depicting correlation between overlap of pre- and postsynaptic elements (x-axis) and frequency of synaptic contacts (y-axis). Counted for the VNC microvolume; overall number of presynaptic elements over 1 µm length: 40; postsynaptic elements: 105. For example, only 17% of the pre- and postsynaptic elements whose envelopes overlap less than 10% actually form synaptic contacts.

Similar articles

Cited by

References

    1. Hartenstein V, Spindler S, Pereanu W, Fung S. The development of the Drosophila larval brain. Adv Exp Med Biol. 2008;628:1–31. - PubMed
    1. Hartenstein V, Cardona A, Pereanu W, Younossi-Hartenstein A. Modeling the developing Drosophila brain: rationale, technique and application. BioScience. 2008;58:823–836.
    1. Cropley V. L, Fujita M, Innis R. B, Nathan P. J. Molecular imaging of the dopaminergic system and its association with human cognitive function. Biol Psychiatry. 2006;59:898–907. - PubMed
    1. May A. Neuroimaging: visualising the brain in pain. Neurol Sci. 2007;28(Suppl 2):S101–S107. - PubMed
    1. Shibasaki H. Human brain mapping: hemodynamic response and electrophysiology. Clin Neurophysiol. 2008;119:731–743. - PubMed

Publication types

MeSH terms

LinkOut - more resources