. 2010 Dec;30(24):5686-97.
doi: 10.1128/MCB.00975-10. Epub 2010 Oct 18.

The mammalian Sin3 proteins are required for muscle development and sarcomere specification

Affiliations

The mammalian Sin3 proteins are required for muscle development and sarcomere specification

Chris van Oevelen et al. Mol Cell Biol. 2010 Dec.

Abstract

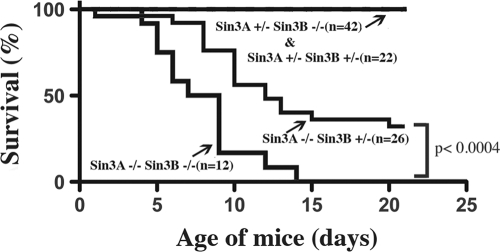
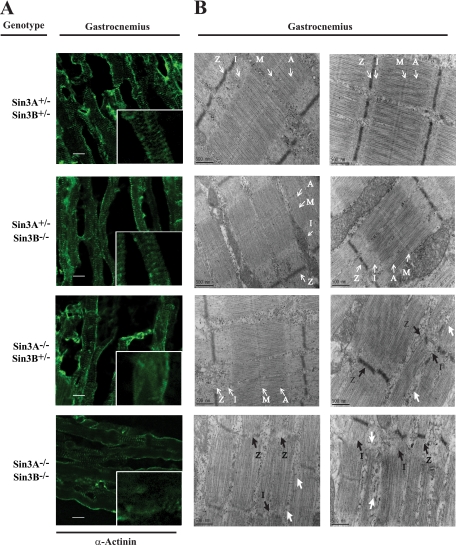
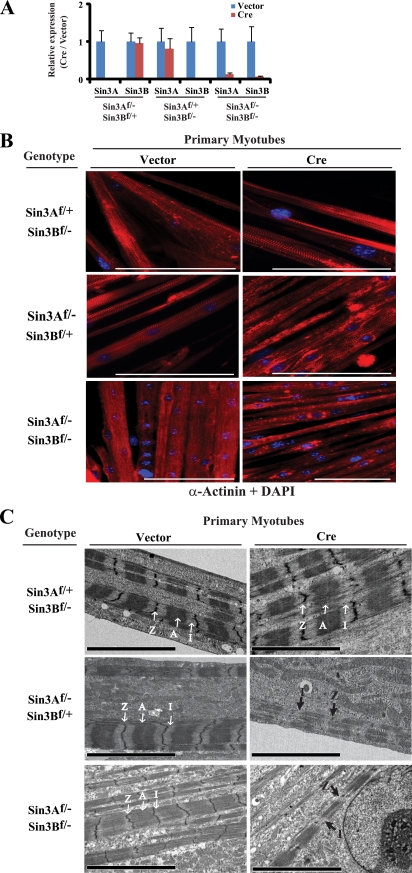
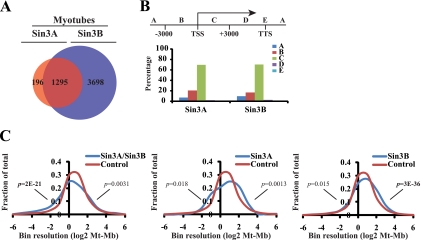
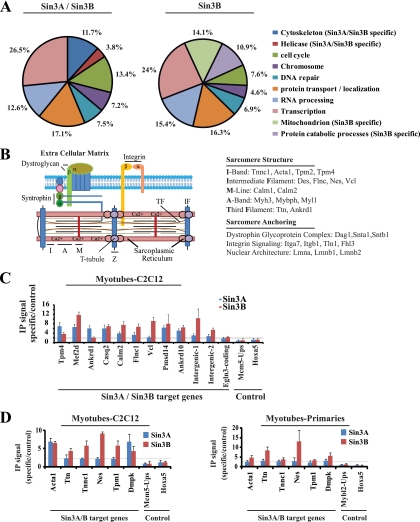
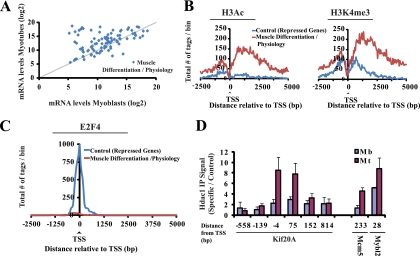
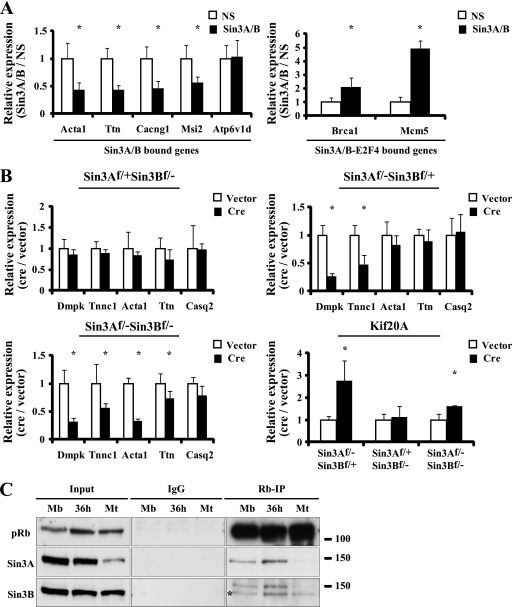
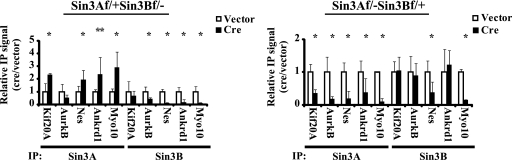
The highly related mammalian Sin3A and Sin3B proteins provide a versatile platform for chromatin-modifying activities. Sin3-containing complexes play a role in gene repression through deacetylation of nucleosomes. Here, we explore a role for Sin3 in myogenesis by examining the phenotypes resulting from acute somatic deletion of both isoforms in vivo and from primary myotubes in vitro. Myotubes ablated for Sin3A alone, but not Sin3B, displayed gross defects in sarcomere structure that were considerably enhanced upon simultaneous ablation of both isoforms. Massively parallel sequencing of Sin3A- and Sin3B-bound genomic loci revealed a subset of target genes directly involved in sarcomere function that are positively regulated by Sin3A and Sin3B proteins. Both proteins were coordinately recruited to a substantial number of genes. Interestingly, depletion of Sin3B led to compensatory increases in Sin3A recruitment at certain target loci, but Sin3B was never found to compensate for Sin3A loss. Thus, our analyses describe a novel transcriptional role for Sin3A and Sin3B proteins associated with maintenance of differentiated muscle cells.


Figures

FIG. 1.
FIG. 1.
Survival rates of mice conditionally deleted for Sin3 genes. Mice carrying floxed alleles of Sin3A or Sin3B were crossed with MCK-Cre transgenic mice to yield Sin3A+/; Sin3B+/, Sin3A+/; Sin3B−/−, Sin3A−/−; Sin3B+/, and Sin3A−/−; Sin3B−/− mice. Mice showed isoform-specific differences in viability. Ablation of both Sin3A and Sin3B decreased viability significantly (log rank [Mantel-Cox] test).
FIG. 2.
FIG. 2.
Conditional ablation of Sin3 in mouse skeletal muscle provokes severe myofibril defects. Skeletal muscles (gastrocnemius) of floxed MCK-Cre::Sin3 mice were dissected at postnatal day 5 and processed for either immunohistochemistry or electron microscopy (EM). (A) Immunofluorescence detection of α-actinin α2 in longitudinal sections of skeletal muscle cells of Sin3A+/; Sin3B+/ (control), Sin3A+/; Sin3B−/−, Sin3A−/−; Sin3B+/, and Sin3A−/−; Sin3B−/− mice. White squares indicate selected regions shown at higher magnification. Bar, 10 μM. (B) EM analysis of longitudinal sections of skeletal muscle tissue from two different mice from each genotype (first and second columns). The genotypes are identical to those in panel A. Ablation of Sin3A or both Sin3A and Sin3B resulted in severe structural aberrations. White arrows with unfilled arrowheads indicate normal sarcomeric structures. Black and white arrows with solid arrowheads indicate structural abnormalities: black solid arrows indicate disrupted Z discs and I bands, and white solid arrows point to dissociated fibers and large interstitial spaces in between myofibrils. A, A band; I, I band; M, M line; Z, Z disc. Bar, 500 nm.
FIG. 3.
FIG. 3.
Primary myotubes ablated for Sin3 display severe defects in sarcoma structures. Primary myoblasts were isolated from MCK-Cre-negative Sin3Af/−; Sin3Bf/+, Sin3Af/+; Sin3Bf/−, and Sin3Af/−; Sin3Bf/− mice. Primary myoblasts were induced to differentiate, and primary myotubes were infected 48 h after induction of differentiation with adenovirus without (Vector [control]) or with (Cre) Cre recombinase and processed for RT-PCR, immunofluorescence, and EM. (A) Gene expression analysis using quantitative real-time RT-PCR of Sin3A and Sin3B genes after ablation of Sin3A or Sin3B. The expression levels of vector- and Cre-infected cells were normalized to the level for Rbp2, which is expressed at high levels and is not bound by Sin3 in differentiated myotubes. Normalized Cre values were compared with normalized control values. Averages of results from three independent experiments are shown. Error bars represent standard deviations. (B) Immunofluorescence detection of α-actinin α2 and DAPI staining in primary myotubes ablated for Sin3A, Sin3B, or both Sin3A and Sin3B. Bar, 100 μm. (C) EM analyses of longitudinal sections of primary myotubes. Genotypes are as described for panel A. Ablation of Sin3A or both Sin3A and Sin3B resulted in significant structural alterations. White arrows indicate normal sarcomeric structures. Black arrows indicate structural abnormalities. A, A band; I, I band; Z, Z disc. Bar, 5 μm.
FIG. 4.
FIG. 4.
Identification and characterization of Sin3 targets during myogenesis. (A) Venn diagrams showing overlap between Sin3A and Sin3B binding events in differentiated myotubes identified by ChIP-seq. Overlap between Sin3 binding sites was defined within a 250-bp interval. The results of two independent experiments were merged for a final analysis. Binding events were identified using MACS with a cutoff P value of <1 × 10⁻⁷ and a minimal tag cutoff of 8. (B) Genomic distribution of Sin3A and Sin3B binding events during myogenesis. (Upper panel) Definition of regions used to calculate genomic distribution of Sin3A and Sin3B binding events. Region A is without an upstream limit. (Lower panel) The distance of a binding event relative to the transcription start site (TSS) or transcription termination site (TTS) (group E only) was calculated using the median position of a binding event. The total number of peaks per region was expressed as a percentage of the total number of binding events. (C) Distribution of relative expression profiles during differentiation for genes bound by a combination of Sin3A or Sin3B in myotubes deduced from the ChIP-seq data. The numbers of genes bound per group were as follows: for Sin3A/Sin3B, 1,148; for Sin3A, 159; and for Sin3B, 2,994. The background group (Control) consisted of all genes defined in Refseq (version mm9). The hypergeometric distribution test was used to calculate statistical significance. p, P value; Mb, myoblasts; Mt, differentiated myotubes.
FIG. 5.
FIG. 5.
Annotation and verification of Sin3 target genes. (A) Distribution of GO annotations for Sin3A and Sin3B target genes. Sin3A and Sin3B binding sites within a distance comprising bp −3000 to +3000 relative to the TSS were included in the annotation analysis. In some instances, a gene is assigned to more than one category. The chart depicts the distribution of GO categories among genes bound specifically by Sin3B or both proteins in differentiated myotubes. There were no enriched GO categories for genes bound by Sin3A only. The percentage refers to the number of bound genes within a particular category in relation to the total number of bound genes that have a GO annotation. (B) Sin3A and Sin3B bind to a subset of sarcomeric genes in differentiated myotubes. (Left panel) Schematic showing sarcomere and extracellular matrix (ECM). (Right panel) Sin3 target genes encode components of sarcomeric and ECM compartments. (C) Analysis of Sin3A and Sin3B binding in differentiated C2C12 myotubes by qChIP. The IP signal was defined as the ratio of IP/input for a specific amplicon versus a control amplicon (Gapdh). The averages of results from three independent experiments are shown. Error bars represent standard deviations. (D) Analysis of Sin3A and Sin3B binding in differentiated C2C12 myotubes and primary myotubes by ChIP and quantitative real-time PCR. IP signal was defined as the ratio of IP/input for a specific amplicon versus a control amplicon (Gapdh). The averages of results from three independent experiments are shown. Error bars represent standard deviations.
FIG. 6.
FIG. 6.
Sin3A and Sin3B proteins bind to active chromatin on a set of muscle-related genes. (A) Expression of a set of genes involved in muscle differentiation and physiology was analyzed. Values were derived from expression analyses and presented in log2 scale. (B) Distribution of H3Ac and H3K4me3 marks on genes involved in muscle differentiation and physiology (98 genes) and a group of Sin3 target genes that were repressed in myotubes (85 genes). For both groups, the number of tags per 50-bp bin was counted and plotted relative to the transcription start site. (C) Distribution of E2F4 binding events for genes as described for panel D. (D) Analysis of binding of HDAC1 to selected repressed Sin3 target genes in myoblasts (Mb) and differentiated myotubes (Mt) by ChIP and quantitative real-time PCR. The IP signal was defined as the ratio of IP/input for a specific amplicon versus a control amplicon (Gapdh). The averages of results from three independent experiments are shown. Error bars represent standard deviations.
FIG. 7.
FIG. 7.
Sin3A and Sin3B proteins directly control transcription of muscle and sarcomere genes. (A) Gene expression analysis using quantitative real time RT-PCR of selected genes after ablation of both Sin3A and Sin3B in C2C12 myotubes. Myotubes were transfected 48 h after induction of differentiation and were isolated 96 h after transfection. Expression levels of selected genes in Sin3 siRNA-transfected cells were compared to the level for nonspecific control (NS) transfected cells. The averages of results from three independent experiments are shown. Error bars represent standard deviations. (B) Gene expression analysis using quantitative real time RT-PCR of selected genes after ablation of Sin3A, Sin3B, or both proteins. Primary myoblasts were induced to differentiate, and primary myotubes were infected 48 h after induction of differentiation with adenovirus that lacks (Vector) or expresses (Cre) Cre recombinase. The expression levels of control- and Cre-infected cells were normalized to the levels for Rbp2, which is expressed at high levels and not bound by Sin3 in differentiated myotubes. Normalized Cre values were compared with normalized control values. The averages of results from three independent experiments are shown. Error bars represent standard deviations. The asterisk indicates expression levels significantly different from those for the vector control cells (P < 0.05 by Student's t test). (C) Endogenous Sin3A and Sin3B interact with pRB during myogenesis. pRB was immunoprecipitated using nuclear extracts of C2C12 myoblasts and differentiated myotubes. All samples were loaded on a single gel, and Western blots were probed for either Sin3A or Sin3B. The asterisk indicates Sin3B protein.
FIG. 8.
FIG. 8.
Increased Sin3A binding compensates for the loss of Sin3B binding on selected genes. qChIP analysis of Sin3A and Sin3B binding in differentiated primary myotubes ablated for Sin3A or Sin3B was done as described for Fig. 4B. Relative binding is represented by the ratio of signals obtained in Cre- and vector-infected primary myotubes. Error bars represent standard deviations. The asterisk indicates a Sin3A or Sin3B binding signal significantly different from that for the vector control cells (P < 0.05 by Student's t test). The double asterisk indicates a P value of <0.07 by Student's t test for Ankrd1 only.

Similar articles

Cited by

References

    1. Alland, L., R. Muhle, H. Hou, Jr., J. Potes, L. Chin, N. Schreiber-Agus, and R. A. DePinho. 1997. Role for N-CoR and histone deacetylase in Sin3-mediated transcriptional repression. Nature 387:49-55. - PubMed
    1. Ayer, D. E., Q. A. Lawrence, and R. N. Eisenman. 1995. Mad-Max transcriptional repression is mediated by ternary complex formation with mammalian homologs of yeast repressor Sin3. Cell 80:767-776. - PubMed
    1. Batchelor, C. L., and S. J. Winder. 2006. Sparks, signals and shock absorbers: how dystrophin loss causes muscular dystrophy. Trends Cell Biol. 16:198-205. - PubMed
    1. Blais, A., M. Tsikitis, D. Acosta-Alvear, R. Sharan, Y. Kluger, and B. D. Dynlacht. 2005. An initial blueprint for myogenic differentiation. Genes Dev. 19:553-569. - PMC - PubMed
    1. Blais, A., C. J. van Oevelen, R. Margueron, D. Acosta-Alvear, and B. D. Dynlacht. 2007. Retinoblastoma tumor suppressor protein-dependent methylation of histone H3 lysine 27 is associated with irreversible cell cycle exit. J. Cell Biol. 179:1399-1412. - PMC - PubMed

Publication types

Substances