

Sequential recruitment of SAGA and TFIID in a genomic response to DNA damage in Saccharomyces cerevisiae
- PMID: 20956559
- PMCID: PMC3019861
- DOI: 10.1128/MCB.00317-10
Sequential recruitment of SAGA and TFIID in a genomic response to DNA damage in Saccharomyces cerevisiae
Abstract
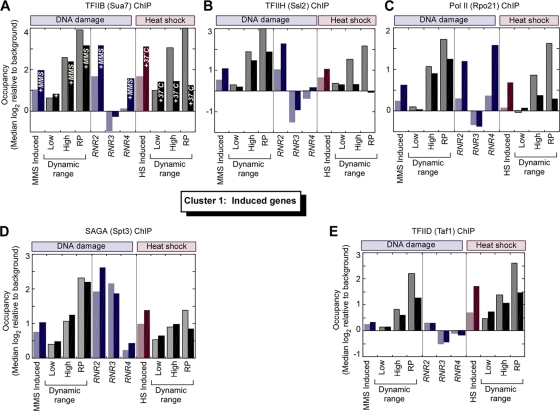
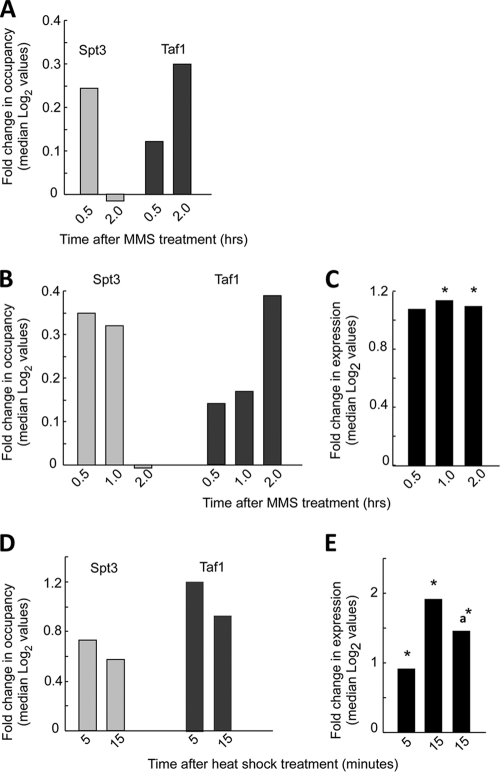
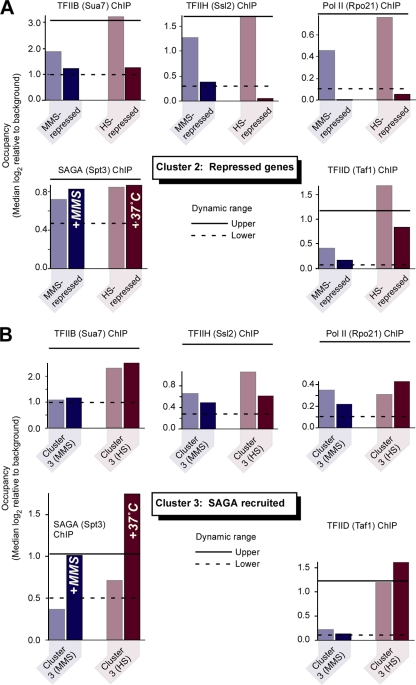
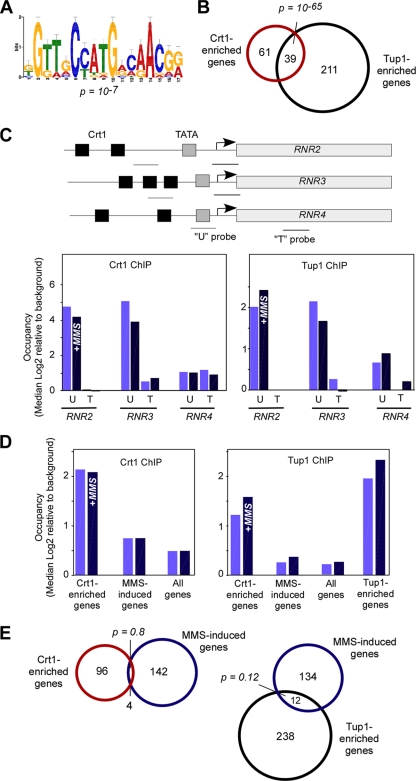
Eukaryotic genes respond to their environment by changing the expression of selected genes. The question we address here is whether distinct transcriptional responses to different environmental signals elicit distinct modes of assembly of the transcription machinery. In particular, we examine transcription complex assembly by the stress-directed SAGA complex versus the housekeeping assembly factor TFIID. We focus on genomic responses to the DNA damaging agent methyl methanesulfonate (MMS) in comparison to responses to acute heat shock, looking at changes in genome-wide factor occupancy measured by chromatin immunoprecipitation-microchip (ChIP-chip) and ChIP-sequencing analyses. Our data suggest that MMS-induced genes undergo transcription complex assembly sequentially, first involving SAGA and then involving a slower TFIID recruitment, whereas heat shock genes utilize the SAGA and TFIID pathways rapidly and in parallel. Also Crt1, the repressor of model MMS-inducible ribonucleotide reductase genes, was found not to play a wider role in repression of DNA damage-inducible genes. Taken together, our findings reveal a distinct involvement of gene and chromatin regulatory factors in response to DNA damage versus heat shock and suggest different implementations of the SAGA and TFIID assembly pathways that may depend upon whether a sustained or transient change in gene expression ensues.
Figures

Similar articles
-
Dissection of coactivator requirement at RNR3 reveals unexpected contributions from TFIID and SAGA.J Biol Chem. 2008 Oct 10;283(41):27360-27368. doi: 10.1074/jbc.M803831200. Epub 2008 Aug 5. J Biol Chem. 2008. PMID: 18682387 Free PMC article.
-
The TAF9 C-terminal conserved region domain is required for SAGA and TFIID promoter occupancy to promote transcriptional activation.Mol Cell Biol. 2014 May;34(9):1547-63. doi: 10.1128/MCB.01060-13. Epub 2014 Feb 18. Mol Cell Biol. 2014. PMID: 24550006 Free PMC article.
-
Plc1p is required for SAGA recruitment and derepression of Sko1p-regulated genes.Mol Biol Cell. 2007 Jul;18(7):2419-28. doi: 10.1091/mbc.e06-10-0946. Epub 2007 Apr 11. Mol Biol Cell. 2007. PMID: 17429070 Free PMC article.
-
The role of chromatin structure in regulating stress-induced transcription in Saccharomyces cerevisiae.Biochem Cell Biol. 2006 Aug;84(4):477-89. doi: 10.1139/o06-079. Biochem Cell Biol. 2006. PMID: 16936821 Review.
-
SAGA and TFIID: Friends of TBP drifting apart.Biochim Biophys Acta Gene Regul Mech. 2021 Feb;1864(2):194604. doi: 10.1016/j.bbagrm.2020.194604. Epub 2020 Jul 14. Biochim Biophys Acta Gene Regul Mech. 2021. PMID: 32673655 Review.
Cited by
-
Inactivating histone deacetylase HDA promotes longevity by mobilizing trehalose metabolism.Nat Commun. 2021 Mar 31;12(1):1981. doi: 10.1038/s41467-021-22257-2. Nat Commun. 2021. PMID: 33790287 Free PMC article.
-
A genetic screen for high copy number suppressors of the synthetic lethality between elg1Δ and srs2Δ in yeast.G3 (Bethesda). 2013 May 20;3(5):917-26. doi: 10.1534/g3.113.005561. G3 (Bethesda). 2013. PMID: 23704284 Free PMC article.
-
The SAGA/TREX-2 subunit Sus1 binds widely to transcribed genes and affects mRNA turnover globally.Epigenetics Chromatin. 2018 Mar 29;11(1):13. doi: 10.1186/s13072-018-0184-2. Epigenetics Chromatin. 2018. PMID: 29598828 Free PMC article.
-
The transcription factor TpRfx1 is an essential regulator of amylase and cellulase gene expression in Talaromyces pinophilus.Biotechnol Biofuels. 2018 Oct 8;11:276. doi: 10.1186/s13068-018-1276-8. eCollection 2018. Biotechnol Biofuels. 2018. PMID: 30337955 Free PMC article.
-
PI signal transduction and ubiquitination respond to dehydration stress in the red seaweed Gloiopeltis furcata under successive tidal cycles.BMC Plant Biol. 2019 Nov 27;19(1):516. doi: 10.1186/s12870-019-2125-z. BMC Plant Biol. 2019. PMID: 31771523 Free PMC article.
References
-
- Boffa, L. C., and C. Bolognesi. 1985. Nuclear proteins damage by alkylating agents with different degrees of carcinogenicity. Chem. Biol. Interact. 55:235-245. - PubMed
-
- Brown, C. E., L. Howe, K. Sousa, S. C. Alley, M. J. Carrozza, S. Tan, and J. L. Workman. 2001. Recruitment of HAT complexes by direct activator interactions with the ATM-related Tra1 subunit. Science 292:2333-2337. - PubMed
-
- Chitikila, C., K. L. Huisinga, J. D. Irvin, A. D. Basehoar, and B. F. Pugh. 2002. Interplay of TBP inhibitors in global transcriptional control. Mol. Cell 10:871-882. - PubMed
Publication types
MeSH terms
Substances
Grants and funding
LinkOut - more resources
Full Text Sources
Molecular Biology Databases