. 2010 Dec;11(12):1093-101.
doi: 10.1038/ni.1952. Epub 2010 Oct 17.

IL-35-mediated induction of a potent regulatory T cell population

Affiliations

IL-35-mediated induction of a potent regulatory T cell population

Lauren W Collison et al. Nat Immunol. 2010 Dec.

Abstract

Regulatory T cells (T(reg) cells) have a critical role in the maintenance of immunological self-tolerance. Here we show that treatment of naive human or mouse T cells with IL-35 induced a regulatory population, which we call 'iT(R)35 cells', that mediated suppression via IL-35 but not via the inhibitory cytokines IL-10 or transforming growth factor-β (TGF-β). We found that iT(R)35 cells did not express or require the transcription factor Foxp3, and were strongly suppressive and stable in vivo. T(reg) cells induced the generation of iT(R)35 cells in an IL-35- and IL-10-dependent manner in vitro and induced their generation in vivo under inflammatory conditions in intestines infected with Trichuris muris and within the tumor microenvironment (B16 melanoma and MC38 colorectal adenocarcinoma), where they contributed to the regulatory milieu. Thus, iT(R)35 cells constitute a key mediator of infectious tolerance and contribute to T(reg) cell-mediated tumor progression. Furthermore, iT(R)35 cells generated ex vivo might have therapeutic utility.


Conflict of interest statement

COMPETING FINANCIAL INTERESTS

The authors declare competing financial interests.

Figures

Figure 1
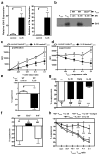
Figure 1. Human IL-35 treatment of Tconv induces autocrine IL-35 expression and confers a regulatory phenotype
Tconv purified by FACS from cord blood were treated with IL-35 or control at 25% of total culture volume for 9 days during activation (αCD3/CD28, and IL-2). (a) RNA was extracted, cDNA generated and qPCR performed. Relative Ebi3 (left panel) and Il12a (right panel) mRNA expression. (b) Cytokine treated cells were re-purified and stained with an isotype or a p35-specific antibody following 4h activation with PMA and ionomycin. Intracellular staining of IL-35 was determined by FACS. (c) Microscopic analysis of p35 expression was similarly determined following 4h activation with PMA and ionomycin. Anti- p35 or isotype control antibodies (shown in red), phalloidin (shown in green) and DAPI (shown in blue). (d) Proliferation of cytokine treated cells was determined by [3H]-thymidine incorporation (e) Tconv cells were mixed at indicated ratios (Tconv: suppressor) with control or IL-35 treated Tconv, hIL-2 and anti-CD3- + anti-CD28-coated latex beads for 9 days. Proliferation was determined by [3H]-thymidine incorporation. The mean of 4 representative experiments with similar cpm is shown. (f) Control or IL-35 treated Tconv were cultured in the top chambers of a Transwell culture plate as indicated. Freshly purified responder Tconv were cultured in the bottom chamber of the 96-well flat bottom plates in medium containing hIL-2 and anti-CD3- + anti-CD28-coated latex beads. Top chambers were removed and [3H]-thymidine was added directly to the responder Tconv cells in the bottom chambers of the original Transwell plate for the final 8 h of the 9 day assay. (g) Tconv cells were activated in the presence of IL-35 at 25% of total culture volume. Following conversion with cytokines, suppression assays were supplemented with neutralizing IL-10, TGFβ, or IL-35 to assess their requirement for indicated cytokines to mediate suppression. Counts per minute of Tconv cells activated alone, in the absence of control or IL-35, were 20,000–125,000 (f) and 25,000 – 570,000 (g). Data represent the mean ± SEM of (a)10 (b) 4, (c-g) independent experiments [* p < 0.05, ** p < 0.005, *** p < 0.001, NS = not significant].
Figure 2
Figure 2. Murine IL-35 treatment of Tconv converts cells to an IL-35 producing suppressive population
Tconv purified by FACS from C57BL/6, Ebi3−/− or Il10−/− mice were treated with indicated cytokines for 72 h during activation (αCD3/CD28). (a) RNA was extracted and cDNA generated from Tconv following control or IL-35 treatment. Relative Ebi3 (left panel) and Il12a (right panel) mRNA expression. (b) Tconv cells were cultured with control protein or IL-35 for 72 h. Cells were re-purified and cultured for an additional 24 h to facilitate IL-35 secretion. Culture supernatants from indicated cultures, or Tconv and Treg as control, were immunoprecipitated with anti-p35 mAb, resolved by SDS-PAGE and probed with anti-Ebi3 mAb to identify IL-35 secretion. (c) Proliferative capacity, determined by [3H]-thymidine incorporation, of Tconv treated with indicated cytokines for 72 h. (d) Tconv cells were mixed at indicated ratios (Tconv: suppressor) with control or IL-35 treated Tconv and anti-CD3- + anti-CD28-coated latex beads for 72 h. Proliferation was determined by [3H]-thymidine incorporation (e) Control or IL-35 treated Tconv were cultured in the top chambers of a Transwell culture plate as indicated. Freshly purified wild-type responder Tconv were cultured in the bottom chamber of the 96-well flat bottom plates in medium containing anti-CD3- + anti-CD28-coated latex beads. After 60 h in culture, top chambers were removed and [3H]-thymidine was added directly to the responder Tconv cells in the bottom chambers of the original Transwell plate for the final 8 h of the 72 h assay. (f) Tconv from C57BL/6, Ebi3−/− or Il10−/− mice were activated in the presence of IL-35 at 25% of total culture volume, for 72 h to generate suppressive cells. Cells were re-purified and mixed at 4:1 ratio (Tconv: suppressor) and proliferation was determined. (g) Wild-type Tconv cells were activated in the presence of IL-35 at 25% of total culture volume. Following conversion with cytokines, suppression assays were supplemented with neutralizing IL-10, TGFβ, or IL-35 to assess their requirement for indicated cytokines to mediate suppression. Cells were cultured at a 4:1 ratio in suppression assays as described in e. (h) Suppressive capacity of IL-35 treated Tconv cells supplemented with titrations of isotype control or neutralizing IL-35 mAbs. Counts per minute of Tconv cells activated alone were 21,000–64,000 (e-h). Data represent the mean ± SEM of 4–8 independent experiments [* p < 0.05, ** p < 0.005, *** p < 0.001, NS = not significant].
Figure 3
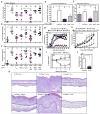
Figure 3. iTR35 are suppressive in vivo
Control treated (iTRcontrol), IL-35 treated (iTR35) or TGFβ treated (TGFβ iTR) cells were generated from FACS purified Tconv from wild type C57BL/6 or Ebi3−/− mice. (a-c) Cells were injected i.p. into 2–3 day old Foxp3−/− mice. Recovery from disease was monitored and reported by reduction in (a) clinical score (b) splenic CD4+ T cell number as determined by flow cytometric analysis and (c) combined histological score from lungs, liver and skin (d) Representative histopathology images of ear pinna following T cell transfer into Foxp3−/− mice. Panel 1: Wild type mouse receiving no Tregs is normal and has no inflammatory cells in the dermis. Panel 2: Foxp3−/− mouse receiving no Tregs is thickened with a dense inflammatory cell infiltrate causing distortion of the cartilage. Panel 3: Foxp3−/− mouse receiving nTregs is mildly thickened with mild edema and a sparse inflammatory cell infiltrate. Panel 4: Foxp3−/− mouse receiving TGFβ iTR cells is moderately thickened with inflammatory cells separated by edema fluid. Panel 5: Foxp3−/− mouse receiving iTRcontrol cells is markedly thickened with edema dispersed inflammatory cells causing distortion of the cartilage. Panel 6: Foxp3−/− mouse receiving iTR35 cells is mildly thickened with edema and a mild inflammatory cell infiltrate. (e-j) iTRcontrol or iTR35 were generated from FACS purified Tconv from C57BL/6 or Ebi3−/− (Thy1.2) or B6.PL (Thy1.1) mice. (e) Homeostatic expansion was monitored by i.v. injection of Thy1.1+ Tconv cells alone or with Thy1.2+ iTRcontrol or iTR35 cells (as regulatory cells) into Rag1−/− mice. Seven days after transfer, splenic T cell numbers were determined by flow cytometry. Thy1.2+ regulatory T cell numbers (e). Thy1.1+ target Tconv cell numbers (f). (g) EAE was induced by immunizing mice with MOG35–55 peptide in complete Freund’s adjuvant followed by pertussis toxin administration. iTRcontrol, iTR35 or nTreg (106) were transferred i.v. into C57BL/6 mice 12–18 hours prior to disease induction. Clinical disease was monitored daily. (h) Rag1−/− mice received indicated cells via the tail vein on day –1 of experiment. On day 0, all were injected with 120,000 B16 cells i.d. in the right flank. Tumor diameter was measured daily for 15 days and is reported as mm3. (i-j) IBD was induced by injecting Rag1−/− mice with Tconv cells via the tail vein. After 3–4 weeks, mice developed clinical symptoms of IBD and were given iTRcontrol or iTR35 cells. Percentage weight change after iTRcontrol or iTR35 cell transfer (i). (j) Colonic histology scores of experimental mice. Data represent the mean ± SEM of 8–12 mice per group from at least 2 independent experiments [* p < 0.05, ** p < 0.005, *** p < 0.001, NS = not significant].
Figure 4
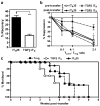
Figure 4. Comparative stability of iTR35 and TGFβ iTR in vivo
iTR35 or TGFβ iTR were generated in vitro with CD45.2+ Tconv cells and adoptively transferred into CD45.1+ C57BL/6 mice to assess stability. (a) Splenic iTR cell number was determined by flow cytometric analysis of CD45.2+ cells. Percentage of total cells injected that were recovered 25 days post-transfer. (b) Tconv cells were mixed at indicated ratios (Tconv: suppressor) with either freshly generated iTR cells (pre-transfer) or iTR cells recovered after in vivo resting (post-transfer) and anti-CD3- + anti-CD28-coated latex beads for 72 h. Proliferation was determined by [3H]-thymidine incorporation. (c) Natural Tregs or iTR were injected into 2–3 day old Foxp3−/− mice. Mice were monitored for clinical signs of sickness and scored accordingly. Mice obtaining a clinical score of 4 were considered moribund. Survival, based on longevity of mice, was significantly less in recipients of TGFβ iTR when compared to nTregs. Conversely, mice that received iTR35 survived significantly longer than those that received nTregs (p < 0.005). Counts per minute of Tconv cells activated alone were 18,000–44,000 (b). Data represent the mean ± SEM of 5–12 mice per group from at least 2 independent experiments [* p < 0.05, *** p < 0.005].
Figure 5
Figure 5. Tregs generate iTR35 in an IL-35- and IL-10-dependent manner
Tconv were activated in the presence of Treg at a 4:1 ratio (responder: suppressor) for 72 h. (a) RNA was extracted and cDNA generated from resting or activated Tconv cells or from Tconv:Treg co-cultures (resorted based on differential Thy1 markers). Ebi3 (a) and Il12a (b) expression of the populations indicated. (c) Following co-culture, suppressed Tconv were re-purified and cultured for an additional 24 h. Secretion of IL-35 was determined by IP/WB of culture supernatants and compared to that of freshly cultured Tconv and Treg. (d) Following co-culture, suppressed Tconv were re-purified and activated (αCD3/CD28). Proliferative capacity was assayed by [3H]-thymidine incorporation. (e) The suppressive capacity of suppressed Tconv upon fresh responder Tconv cells was determined by [3H]-thymidine incorporation. (f) Anti-IL-10, anti-TGFβ, or anti-IL-35 neutralizing antibodies were added to co-cultures to inhibit cytokine driven “conversion” into suppressed Tconv (top panel) or added in secondary proliferation assays to inhibit cytokine driven suppression of “function” (bottom panel). (g) Tconv cells alone or with C57BL/6, Ebi3−/− suppressed Tconv (as regulatory cells) were injected into Rag1−/− mice. Seven days after transfer, splenic T cell numbers were determined by flow cytometry. (h) EAE was induced by immunizing mice with MOG35–55 peptide in complete Freund’s adjuvant followed by pertussis toxin administration. 1 × 10⁶ suppressed Tconv or natural Treg were transferred i.v. into C57BL/6 mice 12–18 hours prior to disease induction. Clinical disease was monitored daily. Clinical score was statistically significant between mice receiving saline control and Treg or suppressed Tconv at days 16–18. Counts per minute of Tconv cells activated alone were 14,000–34,000 (e, f). Data represent the mean ± SEM of 8–12 mice per group from at least 2 independent experiments [* p < 0.05, ** p < 0.005, *** p < 0.001, NS = not significant].
Figure 6
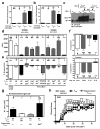
Figure 6. IL-35-producing Foxp3 iTR35 develop in vivo
Foxp3gfp mice were infected with Trichuris muris. CD4+Foxp3 and CD4+Foxp3+ cells were purified from spleen, small intestine IEL and LPL, or large intestine IEL and LPL by FACS, RNA extracted and cDNA generated. Ebi3 (a) and Il12a (b) expression of the populations indicated. (c, d, g, h) Foxp3gfp mice or Ebi3−/− Foxp3gfp were injected with 120,000 B16 cells i.d. on the right flank. Tumors and spleens were excised after 15–17 days, CD4+Foxp3 and CD4+Foxp3+ cells, purified by FACS, RNA extracted and cDNA generated. Ebi3 (c) and Il12a (d) expression of the populations indicated. (e, f) Foxp3gfp mice or Ebi3−/− Foxp3gfp were injected with 2×10⁶ MC38 cells subcutaneously on the right flank. Tumors and spleens were excised after 12 days, CD4+Foxp3 and CD4+Foxp3+ cells purified by FACS, RNA extracted and cDNA generated. Ebi3 (e) and Il12a (f) expression of the populations indicated. (g) Following B16 cell inoculation, purified T cells from the spleen or tumor were cultured for 24 h to allow secretion of IL-35. Culture supernatants from indicated cultures were immunoprecipitated with anti-p35 mAb, resolved by SDS-PAGE and probed with anti-Ebi3 mAb to identify IL-35 secretion. No IL-35 secretion was seen in either the splenic or tumor-infiltrating lymphocytes from Ebi3−/− mice (g). Purified cells were assayed for regulatory capacity by mixing populations indicated at a 4:1 ratio with fresh responder Tconv cells for 72 h. Proliferation was determined by [3H]-thymidine incorporation. Counts per minute of Tconv cells activated alone were 16,000–33,000 (h). Data represent the mean ± SEM of 8–10 mice per group from 2–3 independent experiments (B16) and 1 experiment (MC38) [* p < 0.05, ** p < 0.005, *** p < 0.001, NS = not significant].
Figure 7
Figure 7. The suppressive T cell milieu in the tumor microenvironment is largely due to iTR35
Rag1−/− mice were reconstituted with wild type C57BL/6 CD8+ T cells and wild type or Ebi3−/− Tconv cells with or without wild type Tregs. The following day, all mice were injected with 120,000 B16 cells i.d. on the right flank. Tumors were excised on day 15 post-inoculation to facilitate analysis of tumor infiltrating lymphocytes and tumor diameter reported as mm3. Data represent the mean ± SEM of 6–12 mice per group from at least 2 independent experiments [* p < 0.05, *** p < 0.005, NS = not significant].

Comment in

  • Regulatory ripples.
    Belkaid Y, Chen W. Belkaid Y, et al. Nat Immunol. 2010 Dec;11(12):1077-8. doi: 10.1038/ni1210-1077. Nat Immunol. 2010. PMID: 21079629 Free PMC article. Review.

Similar articles

Cited by

References

    1. Fontenot JD, et al. Regulatory T cell lineage specification by the forkhead transcription factor foxp3. Immunity. 2005;22:329–341. - PubMed
    1. Gavin MA, et al. Foxp3-dependent programme of regulatory T-cell differentiation. Nature. 2007;445:771–775. - PubMed
    1. Hori S, Nomura T, Sakaguchi S. Control of regulatory T cell development by the transcription factor Foxp3. Science. 2003;299:1057–1061. - PubMed
    1. Shevach EM, et al. The lifestyle of naturally occurring CD4+ CD25+ Foxp3+ regulatory T cells. Immunol Rev. 2006;212:60–73. - PubMed
    1. Waldmann H, Adams E, Fairchild P, Cobbold S. Infectious tolerance and the long-term acceptance of transplanted tissue. Immunol Rev. 2006;212:301–313. - PubMed

MeSH terms