. 2010 Oct 18;191(2):269-80.
doi: 10.1083/jcb.201006129. Epub 2010 Oct 11.

Aurora B kinase controls the targeting of the Astrin-SKAP complex to bioriented kinetochores

Affiliations

Aurora B kinase controls the targeting of the Astrin-SKAP complex to bioriented kinetochores

Jens C Schmidt et al. J Cell Biol. .

Abstract

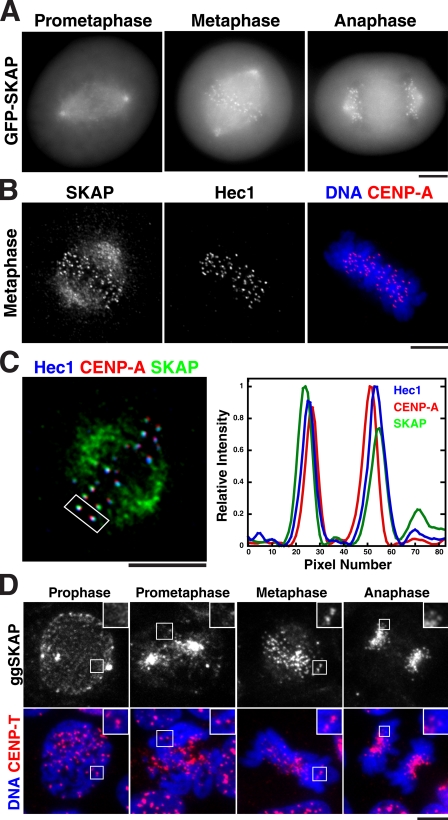
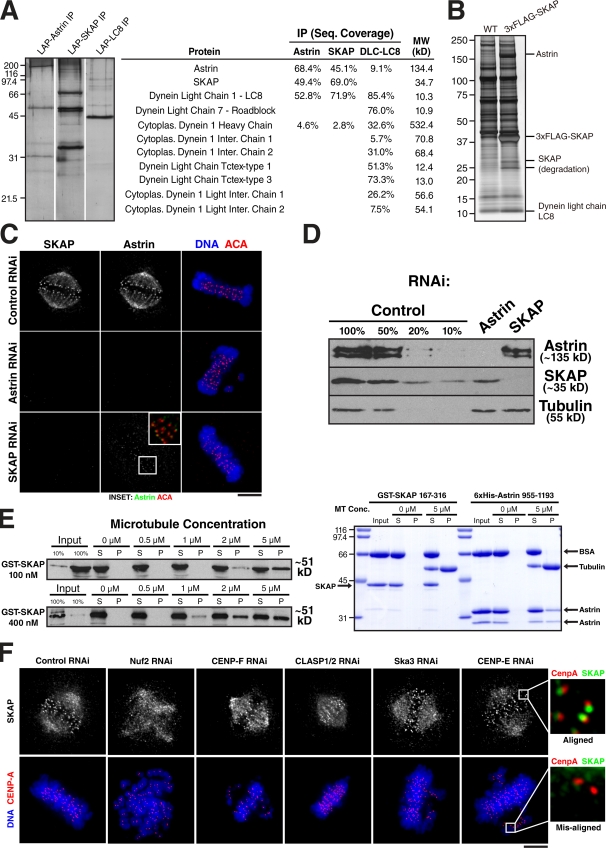
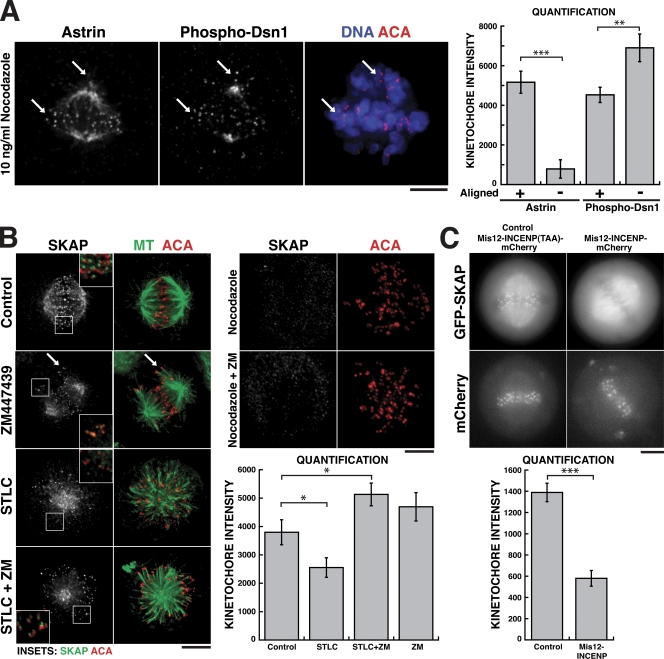
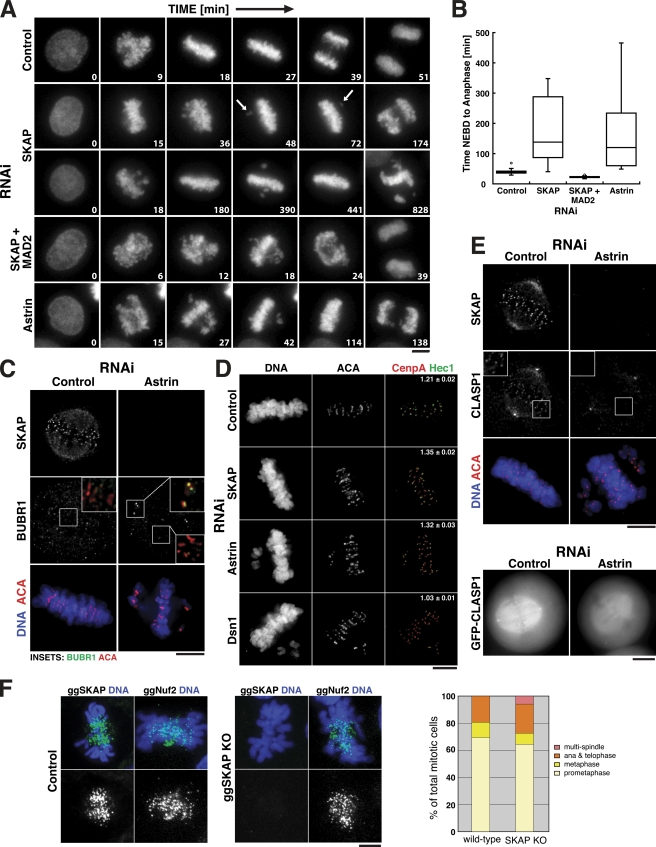
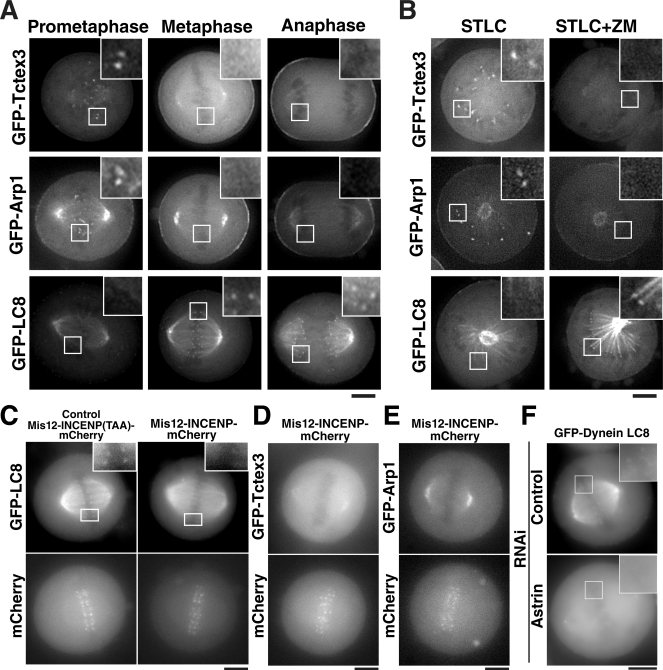
During mitosis, kinetochores play multiple roles to generate interactions with microtubules, and direct chromosome congression, biorientation, error correction, and anaphase segregation. However, it is unclear what changes at the kinetochore facilitate these distinct activities. Here, we describe a complex of the spindle- and kinetochore-associated protein Astrin, the small kinetochore-associated protein (SKAP), and the dynein light chain LC8. Although most dynein-associated proteins localize to unaligned kinetochores in an Aurora B-dependent manner, Astrin, SKAP, and LC8 localization is antagonized by Aurora B such that they target exclusively to bioriented kinetochores. Astrin-SKAP-depleted cells fail to maintain proper chromosome alignment, resulting in a spindle assembly checkpoint-dependent mitotic delay. Consistent with a role in stabilizing bioriented attachments, Astrin and SKAP bind directly to microtubules and are required for CLASP localization to kinetochores. In total, our results suggest that tension-dependent Aurora B phosphorylation can act to control outer kinetochore composition to provide distinct activities to prometaphase and metaphase kinetochores.


Figures

Figure 1.
Figure 1.
SKAP localizes to the outer kinetochore during metaphase and anaphase. (A) Images of different mitotic stages from a clonal human cell line stably expressing moderate amounts of GFPLAP-SKAP. GFP-SKAP localizes to spindle microtubules throughout mitosis, and kinetochores during metaphase and anaphase. (B) Immunofluorescence showing the colocalization of SKAP and Hec1/Ndc80 with DNA (blue) and CENP-A (red). (C, left) Immunofluorescence image showing the colocalization of SKAP (green), Hec1 (blue), and CENP-A (red). (C, right) Graph showing a line scan from the boxed kinetochore pair showing the relative spatial distribution of SKAP, Hec1, and CENP-A. SKAP localizes slightly peripherally to Hec1 at the outer kinetochore. (D) Localization of chicken ggSKAP in DT40 cells. (D, top) SKAP alone. (D, bottom) Colocalization of DNA (blue) and CENP-T (red). Insets show enlarged views of the boxed regions. Bars, 5 µm.
Figure 2.
Figure 2.
SKAP and Astrin form a complex. (A, left) Silver-stained gels showing a one-step IP of GFPLAP-Astrin, GFPLAP-SKAP, or GFPLAP-LC8. (A, right) Data from the mass spectrometric analysis of the purifications indicating the percent sequence coverage from each IP. (B) Silver-stained gel showing the purification of FLAG-SKAP from chicken DT40 cells relative to controls. The indicated proteins were identified by excising them from a gel and analyzing them by mass spectrometry. (C) Astrin and SKAP show interdependent localization. Immunofluorescence images showing Astrin and SKAP localization in control cells, or cells depleted for Astrin or SKAP relative to DNA (blue) and kinetochores (ACA; red). (D) Western blot probed for anti-Astrin (top), anti-SKAP (middle), and anti-Tubulin (bottom) antibodies showing the efficiency of SKAP and Astrin depletion. (E) SKAP and Astrin bind to microtubules in vitro. (E, left) Western blot probed with anti-SKAP antibodies showing the cosedimentation of GST-SKAP with microtubules. (E, right) Coomassie stained gel showing the cosedimentation of a fragment of Astrin (955–1193) with microtubules, but the inability of GST-SKAP C-terminal fragment to bind to microtubules. (F) SKAP localizes exclusively to aligned kinetochores. Immunofluorescence images showing SKAP localization in cells treated with control siRNAs or siRNAs against Nuf2, CENP-E, CENP-F, CLASP1 and CLASP2, or Ska3. DNA is shown in blue, and CENP-A staining is shown in red. SKAP localization requires Nuf2, but does not absolutely require the other proteins. However, in these cases, SKAP localizes only to aligned kinetochores, but not to misaligned kinetochores (enlarged views). Also see Fig. S1. Molecular mass standards are indicated in kilodaltons next to the gel blots. Bars, 5 µm.
Figure 3.
Figure 3.
SKAP localization to kinetochores is counteracted by local Aurora B activity. (A) Astrin localization is inversely proportional to the level of Aurora B phosphorylation at a specific kinetochore. (A, left) Immunofluorescence images showing Astrin localization relative to phospho-Dsn1, and to DNA (blue) and kinetochores (ACA; red), in a cell treated with low-dose nocodazole (10 ng/ml) to generate both aligned and misaligned kinetochores (indicated by arrows). (A, right) Quantification of Astrin and phospho-Dsn1 localization at aligned (n = 5 cells, 59 kinetochores) and misaligned (n = 5 cells, 48 kinetochores) kinetochores. **, a significant difference with P < 0.01; ***, P < 0.001. Bars, 5 µm. (B) Immunofluorescence images showing SKAP localization relative to microtubules and ACA in either control cells (n = 7 cells, 108 kinetochores), cells treated individually the Aurora B inhibitor ZM447439 (n = 6 cells, 90 kinetochores), the Eg5 inhibitor STLC (n = 8 cells, 165 kinetochores), or the microtubule-depolymerizing drug nocodazole, or combinations of STLC and ZM447439 (n = 10 cells, 170 kinetochores) or nocodazole and ZM447439. Quantification of the kinetochore intensity of SKAP (bottom right) indicates that inhibiting Aurora B activity increases the localization of SKAP to kinetochores. *, statistically significant differences with P < 0.05. Insets show enlarged views of the boxed regions. (C) Images from live cells showing the colocalization of GFP-SKAP with either Mis12-INCENP-mCherry (n = 7 cells, 92 kinetochores) or Mis12-INCENP-mCherry fusion in which the residues in INCENP that activate Aurora B are mutated to TAA as a control (n = 7 cells, 92 kinetochores). The Mis12-INCENP fusion increases Aurora B activity at the outer kinetochore (Liu et al., 2009). Quantification (bottom) indicates that the Mis12-INCENP fusion decreases SKAP localization to kinetochores. Error bars indicate SEM. ***, a significant difference with P < 0.001.
Figure 4.
Figure 4.
Astrin and SKAP depletion causes a checkpoint-dependent mitotic arrest. (A) Selected images from time-lapse movies of HeLa cells expressing YFP-H2B in either control cells, SKAP-depleted cells, Astrin-depleted cells, or SKAP and Mad2 codepleted cells. Numbers in each image indicate the relative time in minutes. Also see Videos 1–5. Bar, 5 µm. (B) Box plot showing the quantification of the time from nuclear envelope breakdown (NEBD) to anaphase onset indicating the median time, quartiles, and minimum and maximum values. (C) BubR1 is enriched on misaligned kinetochores in Astrin-depleted cells. Immunofluorescence images showing ACA (red), BubR1 (green), DNA, and SKAP in control and Astrin-depleted cells. (D) Astrin and SKAP depletion increase interkinetochore distance. Immunofluorescence images showing CENP-A (red), Hec1 (green), ACA, and DNA in either control (n = 6 cells, 151 kinetochores), Astrin- (n = 3 cells, 30 kinetochores, P < 0.01), SKAP- (n = 10 cells, 160 kinetochores, P < 0.0001), or Dsn1-depleted cells (n = 6 cells, 130 kinetochores, P < 0.0001). Numbers indicate the mean interkinetochore distance based on CENP-A ± SEM. (E) Astrin is required for CLASP localization to kinetochores. (E, top) Immunofluorescence images showing ACA (red), DNA (blue), CLASP1, and SKAP in either control or Astrin-depleted cells. Insets show enlarged views of the boxed regions. (E, bottom) GFP-CLASP1 localization in live control or Astrin-depleted cells. (F) ggSKAP deletion in chicken DT40 cells does not alter Nuf2 localization. Immunofluorescence images showing ggSKAP or ggNuf2 localization (in green in merge) and DNA (blue) in either control DT40 cells or SKAP knockout cells. See Fig. S2 for the generation of the SKAP knockout cell line. (F) Graph showing the percentage of different mitotic states in either control DT40 cells or ggSKAP knockout cells. Bars, 5 µm.
Figure 5.
Figure 5.
Aurora B provides a switch in the targeting of different dynein subunits to kinetochores. (A) Images showing the localization of the dynein light chains GFPLAP-Tctex3 and GFPLAP-LC8, or the dynactin subunit GFPLAP-Arp1 in different stages of mitosis. (B) Images showing the localization of GFPLAP-Tctex3, GFPLAP-LC8, or GFPLAP-Arp1 in STLC-treated cells, or STLC plus ZM447493–treated cells. (C–E) Images showing the localization of GFPLAP-Tctex3, GFPLAP-LC8, or GFPLAP-Arp1 and either Mis12-INCENP(TAA)-mCherry (control) or Mis12-INCENP-mCherry–transfected cells as indicated. (F) Images showing the localization of GFP-LC8 in either control or Astrin-depleted cells. Insets show enlarged views of the boxed regions. Bars, 5 µm.

Similar articles

Cited by

References

    1. Andrews P.D., Ovechkina Y., Morrice N., Wagenbach M., Duncan K., Wordeman L., Swedlow J.R. 2004. Aurora B regulates MCAK at the mitotic centromere. Dev. Cell. 6:253–268 10.1016/S1534-5807(04)00025-5 - DOI - PubMed
    1. Bakhoum S.F., Genovese G., Compton D.A. 2009a. Deviant kinetochore microtubule dynamics underlie chromosomal instability. Curr. Biol. 19:1937–1942 10.1016/j.cub.2009.09.055 - DOI - PMC - PubMed
    1. Bakhoum S.F., Thompson S.L., Manning A.L., Compton D.A. 2009b. Genome stability is ensured by temporal control of kinetochore-microtubule dynamics. Nat. Cell Biol. 11:27–35 10.1038/ncb1809 - DOI - PMC - PubMed
    1. Chang M.S., Huang C.J., Chen M.L., Chen S.T., Fan C.C., Chu J.M., Lin W.C., Yang Y.C. 2001. Cloning and characterization of hMAP126, a new member of mitotic spindle-associated proteins. Biochem. Biophys. Res. Commun. 287:116–121 10.1006/bbrc.2001.5554 - DOI - PubMed
    1. Cheeseman I.M., Desai A. 2005. A combined approach for the localization and tandem affinity purification of protein complexes from metazoans. Sci. STKE. 2005:pl1 10.1126/stke.2662005pl1 - DOI - PubMed

Publication types

MeSH terms