

Cellular scaling rules for the brains of an extended number of primate species
- PMID: 20926854
- PMCID: PMC2980814
- DOI: 10.1159/000319872
Cellular scaling rules for the brains of an extended number of primate species
Abstract
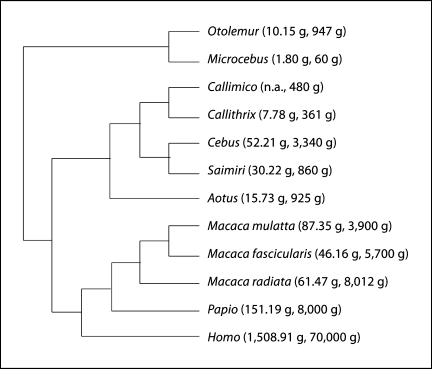
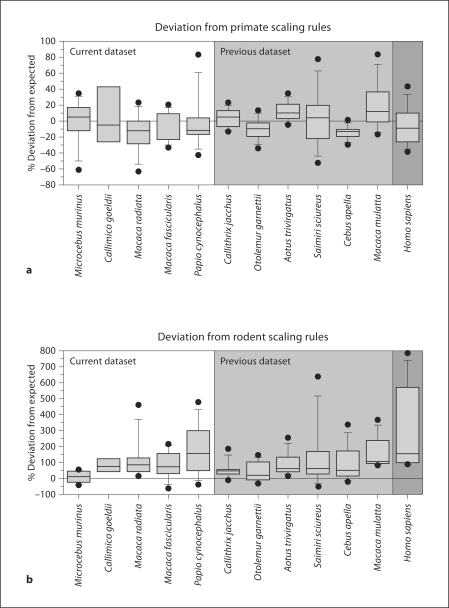
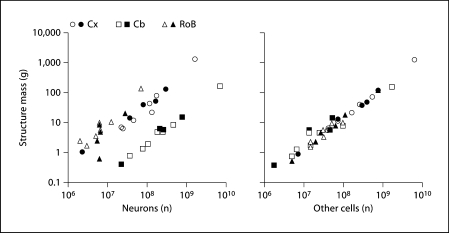
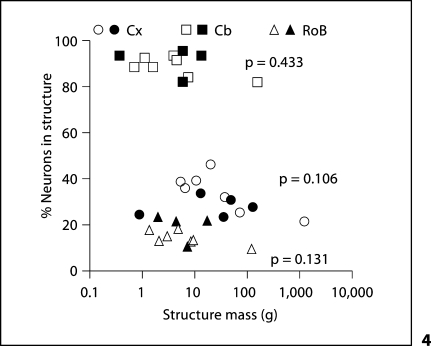
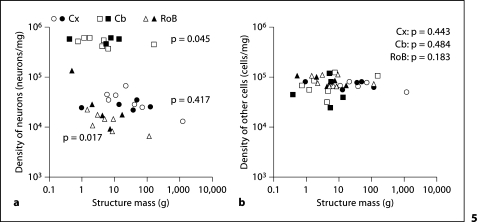
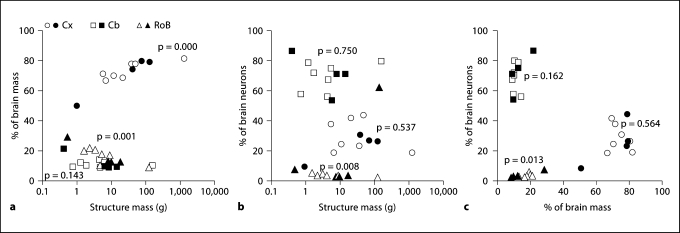
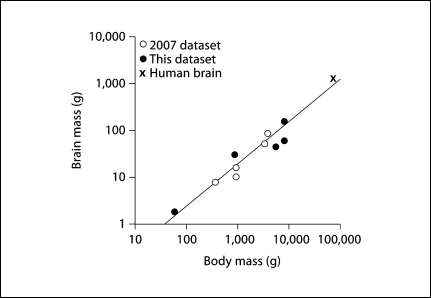
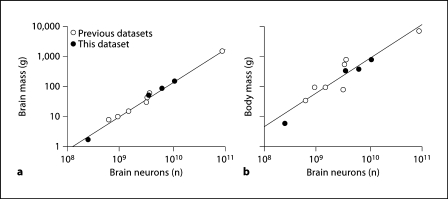
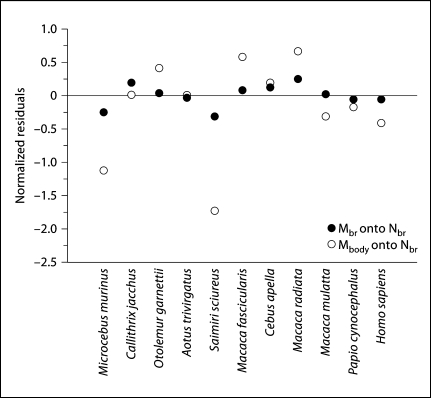
What are the rules relating the size of the brain and its structures to the number of cells that compose them and their average sizes? We have shown previously that the cerebral cortex, cerebellum and the remaining brain structures increase in size as a linear function of their numbers of neurons and non-neuronal cells across 6 species of primates. Here we describe that the cellular composition of the same brain structures of 5 other primate species, as well as humans, conform to the scaling rules identified previously, and that the updated power functions for the extended sample are similar to those determined earlier. Accounting for phylogenetic relatedness in the combined dataset does not affect the scaling slopes that apply to the cerebral cortex and cerebellum, but alters the slope for the remaining brain structures to a value that is similar to that observed in rodents, which raises the possibility that the neuronal scaling rules for these structures are shared among rodents and primates. The conformity of the new set of primate species to the previous rules strongly suggests that the cellular scaling rules we have identified apply to primates in general, including humans, and not only to particular subgroups of primate species. In contrast, the allometric rules relating body and brain size are highly sensitive to the particular species sampled, suggesting that brain size is neither determined by body size nor together with it, but is rather only loosely correlated with body size.
Copyright © 2010 S. Karger AG, Basel.
Figures
Similar articles
-
Gorilla and orangutan brains conform to the primate cellular scaling rules: implications for human evolution.Brain Behav Evol. 2011;77(1):33-44. doi: 10.1159/000322729. Epub 2011 Jan 11. Brain Behav Evol. 2011. PMID: 21228547 Free PMC article.
-
Updated neuronal scaling rules for the brains of Glires (rodents/lagomorphs).Brain Behav Evol. 2011;78(4):302-14. doi: 10.1159/000330825. Epub 2011 Oct 7. Brain Behav Evol. 2011. PMID: 21985803 Free PMC article.
-
Not all brains are made the same: new views on brain scaling in evolution.Brain Behav Evol. 2011;78(1):22-36. doi: 10.1159/000327318. Epub 2011 Jun 17. Brain Behav Evol. 2011. PMID: 21691045 Review.
-
Cellular scaling rules for primate brains.Proc Natl Acad Sci U S A. 2007 Feb 27;104(9):3562-7. doi: 10.1073/pnas.0611396104. Epub 2007 Feb 20. Proc Natl Acad Sci U S A. 2007. PMID: 17360682 Free PMC article.
-
Neuronal scaling rules for primate brains: the primate advantage.Prog Brain Res. 2012;195:325-40. doi: 10.1016/B978-0-444-53860-4.00015-5. Prog Brain Res. 2012. PMID: 22230634 Review.
Cited by
-
The evolution of brain neuron numbers in amniotes.Proc Natl Acad Sci U S A. 2022 Mar 15;119(11):e2121624119. doi: 10.1073/pnas.2121624119. Epub 2022 Mar 7. Proc Natl Acad Sci U S A. 2022. PMID: 35254911 Free PMC article.
-
An adaptive threshold in mammalian neocortical evolution.PLoS Biol. 2014 Nov 18;12(11):e1002000. doi: 10.1371/journal.pbio.1002000. eCollection 2014 Nov. PLoS Biol. 2014. PMID: 25405475 Free PMC article.
-
Cellular scaling rules for primate spinal cords.Brain Behav Evol. 2010;76(1):45-59. doi: 10.1159/000319019. Epub 2010 Sep 30. Brain Behav Evol. 2010. PMID: 20926855 Free PMC article.
-
Validation of the isotropic fractionator: comparison with unbiased stereology and DNA extraction for quantification of glial cells.J Neurosci Methods. 2014 Jan 30;222:165-74. doi: 10.1016/j.jneumeth.2013.11.002. Epub 2013 Nov 12. J Neurosci Methods. 2014. PMID: 24239779 Free PMC article.
-
White matter volume and white/gray matter ratio in mammalian species as a consequence of the universal scaling of cortical folding.Proc Natl Acad Sci U S A. 2019 Jul 23;116(30):15253-15261. doi: 10.1073/pnas.1716956116. Epub 2019 Jul 8. Proc Natl Acad Sci U S A. 2019. PMID: 31285343 Free PMC article.
References
-
- Azevedo FA, Carvalho LR, Grinberg LT, Farfel JM, Ferretti RE, Leite RE, Jacob Filho W, Lent R, Herculano-Houzel S. Equal numbers of neuronal and nonneuronal cells make the human brain an isometrically scaled-up primate brain. J Comp Neurol. 2009;513:532–541. - PubMed
-
- Barton RA, Harvey PH. Mosaic evolution of brain structure in mammals. Nature. 2000;411:189–193. - PubMed
-
- Barton RA. How did brains evolve? Nature. 2002;415:134–135. - PubMed
-
- Clark DA, Mitra PP, Wang SS. Scalable architecture in mammalian brains. Nature. 2001;411:189–193. - PubMed
Publication types
MeSH terms
Substances
Grants and funding
LinkOut - more resources
Full Text Sources
Other Literature Sources
