

Arc regulates spine morphology and maintains network stability in vivo
- PMID: 20921410
- PMCID: PMC2964216
- DOI: 10.1073/pnas.1006546107
Arc regulates spine morphology and maintains network stability in vivo
Abstract
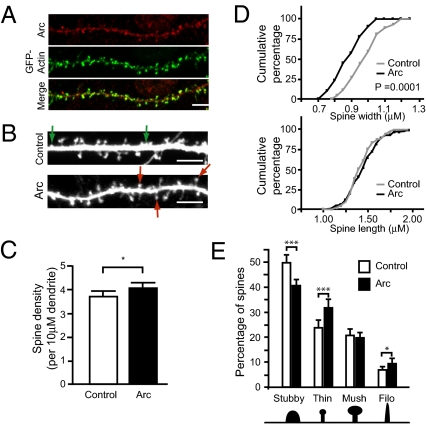
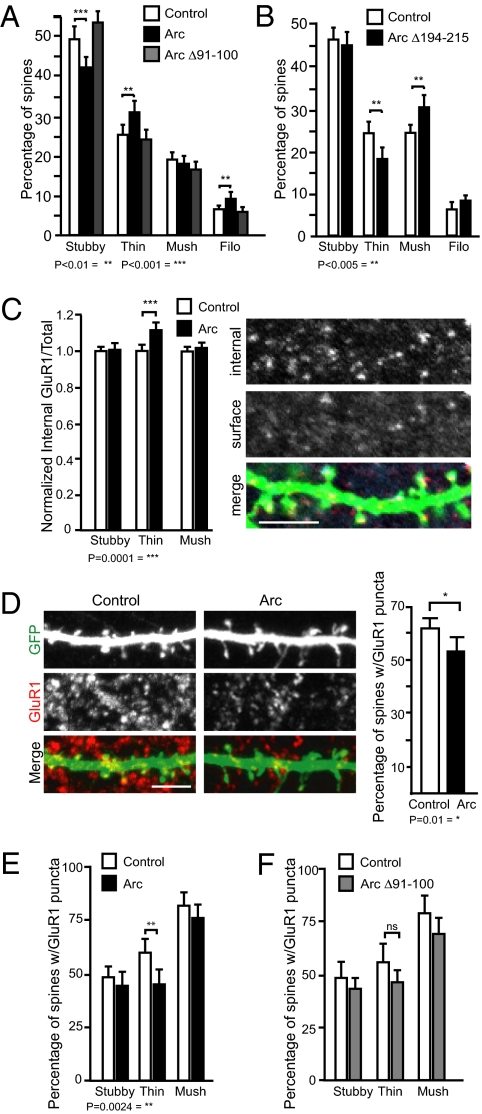
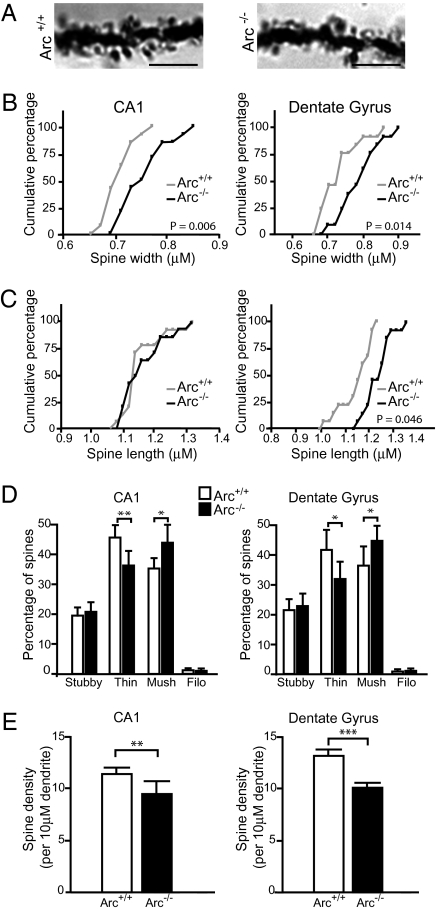
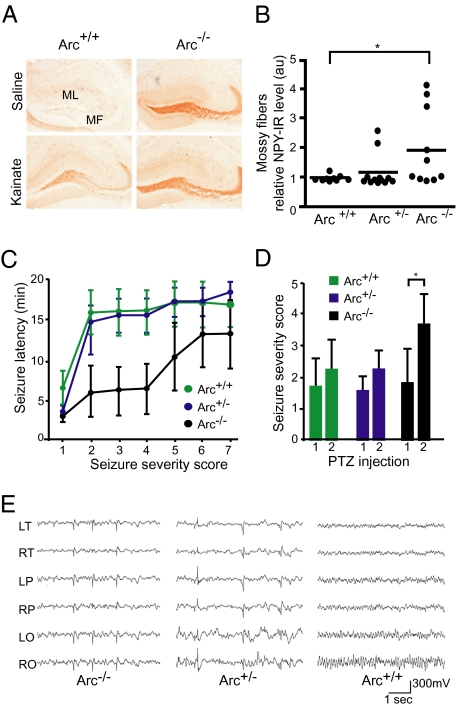
Long-term memory relies on modulation of synaptic connections in response to experience. This plasticity involves trafficking of AMPA receptors (AMPAR) and alteration of spine morphology. Arc, a gene induced by synaptic activity, mediates the endocytosis of AMPA receptors and is required for both long-term and homeostatic plasticity. We found that Arc increases spine density and regulates spine morphology by increasing the proportion of thin spines. Furthermore, Arc specifically reduces surface GluR1 internalization at thin spines, and Arc mutants that fail to facilitate AMPAR endocytosis do not increase the proportion of thin spines, suggesting that Arc-mediated AMPAR endocytosis facilitates alterations in spine morphology. Thus, by linking spine morphology with AMPAR endocytosis, Arc balances synaptic downscaling with increased structural plasticity. Supporting this, loss of Arc in vivo leads to a significant decrease in the proportion of thin spines and an epileptic-like network hyperexcitability.
Conflict of interest statement
The authors declare no conflict of interest.
Figures
Similar articles
-
Arc/Arg3.1 mediates homeostatic synaptic scaling of AMPA receptors.Neuron. 2006 Nov 9;52(3):475-84. doi: 10.1016/j.neuron.2006.08.034. Neuron. 2006. PMID: 17088213 Free PMC article.
-
Insulin can induce the expression of a memory-related synaptic protein through facilitating AMPA receptor endocytosis in rat cortical neurons.Cell Mol Life Sci. 2014 Oct;71(20):4069-80. doi: 10.1007/s00018-014-1620-5. Epub 2014 Apr 6. Cell Mol Life Sci. 2014. PMID: 24705985 Free PMC article.
-
Activity-Regulated Cytoskeleton-Associated Protein Controls AMPAR Endocytosis through a Direct Interaction with Clathrin-Adaptor Protein 2.eNeuro. 2016 May 24;3(3):ENEURO.0144-15.2016. doi: 10.1523/ENEURO.0144-15.2016. eCollection 2016 May-Jun. eNeuro. 2016. PMID: 27257628 Free PMC article.
-
Regulation of neuronal PKA signaling through AKAP targeting dynamics.Eur J Cell Biol. 2006 Jul;85(7):627-33. doi: 10.1016/j.ejcb.2006.01.010. Epub 2006 Feb 28. Eur J Cell Biol. 2006. PMID: 16504338 Review.
-
Arc ubiquitination in synaptic plasticity.Semin Cell Dev Biol. 2018 May;77:10-16. doi: 10.1016/j.semcdb.2017.09.009. Epub 2017 Sep 7. Semin Cell Dev Biol. 2018. PMID: 28890418 Review.
Cited by
-
NREM delta power and AD-relevant tauopathy are associated with shared cortical gene networks.Sci Rep. 2021 Apr 8;11(1):7797. doi: 10.1038/s41598-021-86255-6. Sci Rep. 2021. PMID: 33833255 Free PMC article.
-
Activity-regulated cytoskeletal-associated protein (Arc) in presynaptic terminals and extracellular vesicles in hippocampal synapses.Front Mol Neurosci. 2023 Nov 6;16:1225533. doi: 10.3389/fnmol.2023.1225533. eCollection 2023. Front Mol Neurosci. 2023. PMID: 38025262 Free PMC article.
-
The noncoding circular RNA circHomer1 regulates synaptic development and experience-dependent plasticity in mouse visual cortex.bioRxiv [Preprint]. 2025 Feb 4:2024.07.19.603416. doi: 10.1101/2024.07.19.603416. bioRxiv. 2025. PMID: 39091722 Free PMC article. Preprint.
-
Motor skill learning enhances the expression of activity-regulated cytoskeleton-associated protein in the rat cerebellum.J Comp Physiol A Neuroethol Sens Neural Behav Physiol. 2014 Nov;200(11):959-66. doi: 10.1007/s00359-014-0942-y. Epub 2014 Sep 24. J Comp Physiol A Neuroethol Sens Neural Behav Physiol. 2014. PMID: 25249385
-
mGlu5 Receptors and Relapse to Cocaine-Seeking: The Role of Receptor Trafficking in Postrelapse Extinction Learning Deficits.Neural Plast. 2016;2016:9312508. doi: 10.1155/2016/9312508. Epub 2016 Jan 10. Neural Plast. 2016. PMID: 26881139 Free PMC article.
References
-
- Hering H, Sheng M. Dendritic spines: Structure, dynamics and regulation. Nat Rev Neurosci. 2001;2:880–888. - PubMed
-
- Holtmaat AJ, et al. Transient and persistent dendritic spines in the neocortex in vivo. Neuron. 2005;45:279–291. - PubMed
-
- Bourne J, Harris KM. Do thin spines learn to be mushroom spines that remember? Curr Opin Neurobiol. 2007;17:381–386. - PubMed
Publication types
MeSH terms
Substances
Grants and funding
LinkOut - more resources
Full Text Sources
Molecular Biology Databases
