Review
. 2010 Aug;23(7):849-64.
doi: 10.1002/nbm.1544.

Diffusion imaging of brain tumors

Affiliations
Review

Diffusion imaging of brain tumors

Stephan E Maier et al. NMR Biomed. 2010 Aug.

Abstract

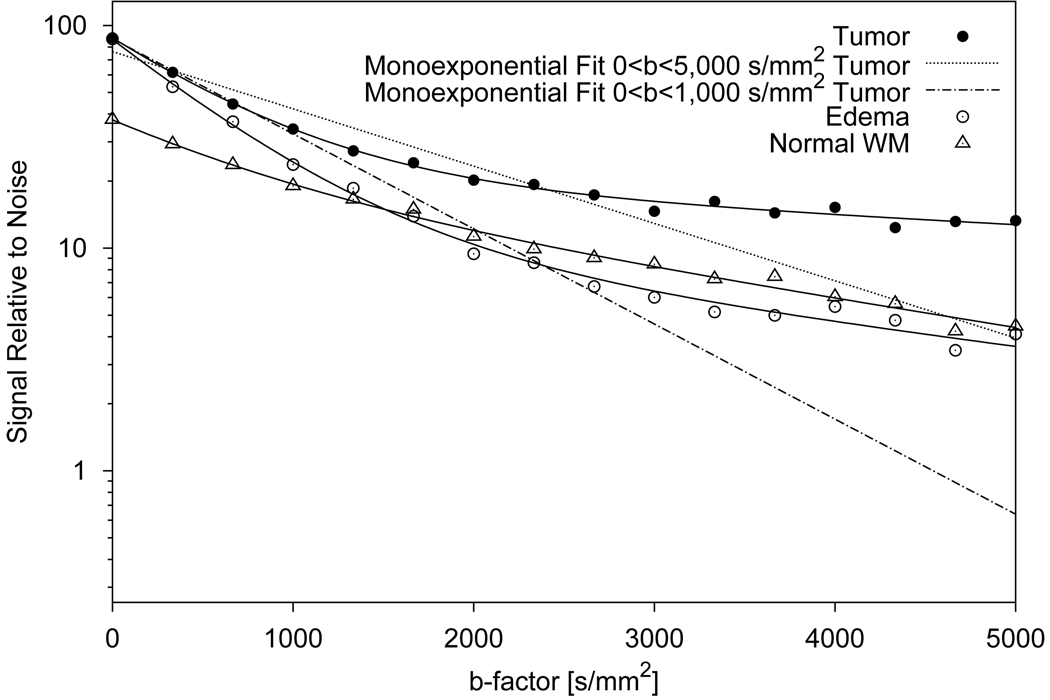
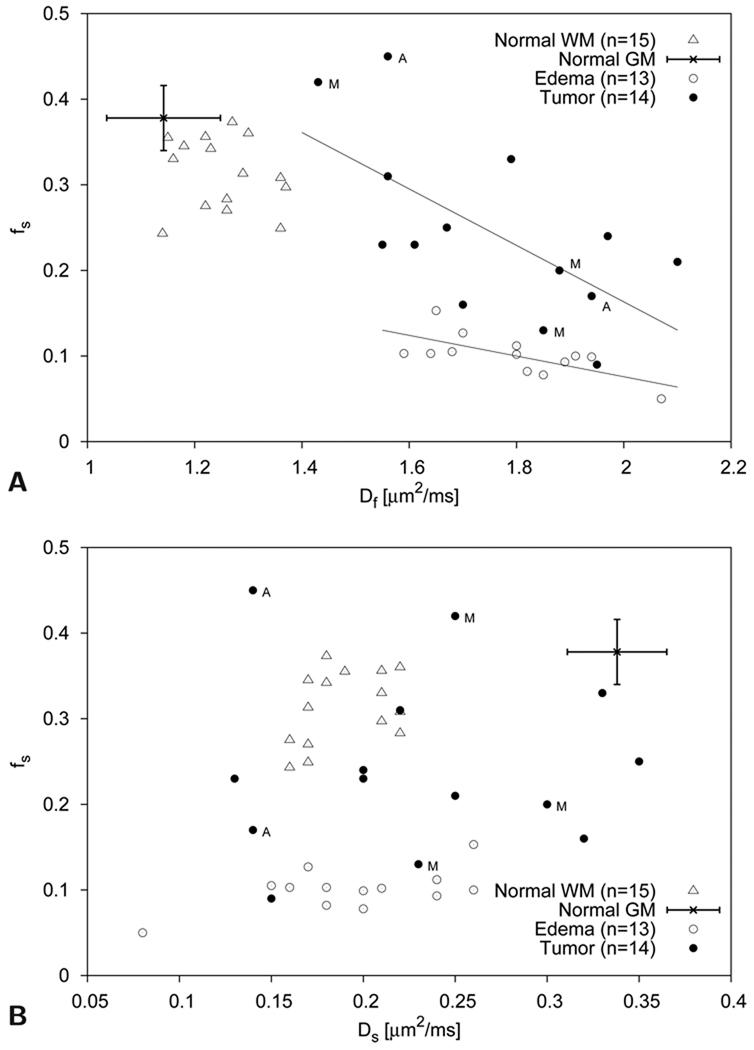
MRI offers a tremendous armamentarium of different methods that can be employed in brain tumor characterization. MR diffusion imaging has become a widely accepted method to probe for the presence of fluid pools and molecular tissue water mobility. For most clinical applications of diffusion imaging, it is assumed that the diffusion signal vs diffusion weighting factor b decays monoexponentially. Within this framework, the measurement of a single diffusion coefficient in brain tumors permits an approximate categorization of tumor type and, for some tumors, definitive diagnosis. In most brain tumors, when compared with normal brain tissue, the diffusion coefficient is elevated. The presence of peritumoral edema, which also exhibits an elevated diffusion coefficient, often precludes the delineation of the tumor on the basis of diffusion information alone. Serially obtained diffusion data are useful to document and even predict the cellular response to drug or radiation therapy. Diffusion measurements in tissues over an extended range of b factors have clearly shown that the monoparametric description of the MR diffusion signal decay is incomplete. Very high diffusion weighting on clinical systems requires substantial compromise in spatial resolution. However, after suitable analysis, superior separation of malignant brain tumors, peritumoral edema and normal brain tissue can be achieved. These findings are also discussed in the light of tissue-specific differences in membrane structure and the restrictions exerted by membranes on diffusion. Finally, measurement of the directional dependence of diffusion permits the assessment of white matter integrity and dislocation. Such information, particularly in conjunction with advanced post-processing, is considered to be immensely useful for therapy planning. Diffusion imaging, which permits monoexponential analysis and provides directional diffusion information, is performed routinely in brain tumor patients. More advanced methods require improvement in acquisition speed and spatial resolution to gain clinical acceptance.


Figures

Figure 1
Figure 1
Axial brain images of a 40 year old female patient with a glioblastoma. A) T1-weighted post-contrast spin-echo image (TR 600 ms/TE 14 ms) shows an enhancing lesion. B) T2-weighted spin-echo image (TR 3,000 ms/TE 92 ms) shows the lesion and larger area with edema. C) The same area on the LSDI mean diffusion-weighted image (b-factor 1,000 s/mm2) appears isointense with the surrounding normal tissue. There is evidence, however, of slight deformation of the ventricle and sulcus anatomy. D) Mean diffusion coefficient map exhibits elevated diffusion both within lesion and edema. ADC measured within the green region of interest (ROI) outline for tumor (defined on the T1-weighted image) is 1.18 µm2/ms and within the red ROI outline for edema 1.35 µm2/ms. Gray and white matter show no obvious difference in diffusion and appear dark gray (ADC=0.76 µm2/ms).
Figure 2
Figure 2
Axial brain images of a frontal glioblastoma with postoperative cyst formation in a 38 year old male patient. A) T1-weighted post-contrast spin-echo image (TR 600 ms/TE 25 ms) predominantly shows the tumor marginal area and not the solid part of the tumor. B) T2-weighted spin-echo image (TR 3,600 ms/TE 98 ms) shows a bright cyst and edema-related hyperintensity. C) Computed slow diffusion component size image with overlaid ROIs for tumor (green, fs=0.23), edema (red, fs=0.11), and normal appearing brain tissue (yellow, fs=0.35). D) LSDI image with a b-factor of 1,000 s/mm2 shows hyperintensity within the tumor. E) LSDI image with a high b-factor of 3,000 s/mm2 also shows hyperintensity within the tumor. F) Very high diffusion-weighted LSDI image with a b-factor of 5,000 s/mm2 exhibits signal above the noise threshold for all tissues. Extraordinary high residual signal, despite high diffusion weighting, is observed in the solid part of the tumor. LSDI images were all obtained with a single diffusion encoding direction and the following scan parameters: 64×48 imaging matrix interpolated to a 25×192 matrix, 220 mm×165 mm field of view, 7.3 mm slice thickness, 2,040 ms TR, 94 ms TE, 16 b-factors. The diffusion values measured with conventional diffusion imaging (b=1,000 s/mm2) were 1.10 µm2/ms for tumor and 0.74 µm2/ms for normal appearing white matter.
Figure 3
Figure 3
Plot of diffusion-attenuated signal vs b-factor for individual pixels in a glioblastoma tumor, normal white matter (WM) and edematous tissue. The solid lines show biexponentially fitted signal decay curves. For tumor tissue, monoexponential fits are shown for the whole diffusion weighting range (0–5,000 s/mm2, dotted line) and for the normal diffusion weighting range (0–1,000 s/mm2, dash-dotted line). Without diffusion weighting, tumor and edema can not be distinguished and exhibit higher signal than normal white matter. With increasing diffusion weighting, the signal of the edematous tissue decreases more rapidly than the signal of the other tissues and approaches the signal level of normal white matter. Tumor tissue exhibits the slowest signal decay and shows the highest residual signal at very high b-factors. On the logarithmic signal scale, the deviation of the signal decay curves from a straight-line monoexponential decay is obvious.
Figure 4
Figure 4
Scatter plots of slow diffusion component size fraction fs vs fast diffusion coefficient Df (top graph) and slow diffusion coefficient Ds (bottom graph) ROI values measured with single-direction diffusion encoding in fourteen tumor patients (nine WHO grade IV glioblastomas, two WHO grade III astrocytomas and three metastases) [7]. Astrocytomas and metastatic tumors are indicated by the letter A and M, respectively. Representative gray matter (GM) values obtained in an other study [63] are also shown. Normal white matter (WM), gray matter, and edematous tissue can readily be separated with these parameters. With the slow diffusion component size fraction fs and the fast diffusion coefficient Df, tumor tissue can also clearly be distinguished from normal white and gray matter. Some overlap is observed between tumor tissue values and edematous tissue values. Indicated with linear least square fits for both tumor (r=−0.64) and edematous (r=−0.69) tissue is the obvious trend towards lower slow diffusion component size fractions fs at higher Df values. Separation of different tumor types based on these diffusion parameters seems difficult, although more samples would be needed to fully address this issue.
Figure 5
Figure 5
Coronal brain images of a 46 year old female patient with a low grade oligodendroglioma (WHO grade II, see Case 2 in Table 3). A) T2-weighted image of LSDI scan obtained with normal diffusion weighting (TR 2,673 ms/TE 66 ms) shows an enhancing lesion. On the other images the corresponding area is indicated by the green ROI outline. B) Map of the mean fast diffusion coefficient Df obtained from high-b LSDI trace data (scan parameter: 128×48 imaging matrix interpolated to a 256×192 matrix, 220 mm×165 mm field of view, 6 mm slice thickness, 2,430 ms TR, and 96 ms TE, 16 b-factors). Within the tumor, Df equals 1.47 µm2/ms and is evidently slightly higher than the Df of the surrounding tissue. C) Map of the mean slow diffusion coefficient Ds shows a clear dissociation between white and gray matter. Ds within the tumor is 0.19 µm2/ms and not distinctly different from the Ds of surrounding white matter. D) On the map of the mean slow diffusion coefficient component size fraction fs the tumor area appears hypointense (fs=0.09). Line artifacts visible in the area of the cerebellum are caused by motion-related signal loss.
Figure 6
Figure 6
Images computed from the patient diffusion data shown in Fig. 2. A) Map of the parameter α obtained with a stretched exponential fit [52]. Compared to normal brain tissue, tumor tissue appears hypointense and edematous tissue slightly hyperintense. B) Map of excess kurtosis K obtained with a fit to a second order polynomial in b [54, 61]. Compared to normal brain tissue, tumor tissue appears hyperintense and edematous tissue hypointense. White matter tracts running orthogonal to the diffusion encoding direction also appear hyperintense. C) Computed χ2 error map of the monoexponential fit to the diffusion related signal decay reveals hyperintensity of the solid part of the tumor and slightly higher intensity within the edematous tissue. Other areas of hyperintensity are due to partial volume effects in voxels with non-uniform tissues or fluid content. For representative values of individual pixels within the different tissues for each analysis method applied see Table 2.
Figure 7
Figure 7
Image data of mouse brain with human U-87 tumor (30×30 mm sub-images shown). Trace diffusion image data shown in A) and B) was obtained with LSDI at 3 Tesla (128×64 matrix interpolated to a 256×128 matrix, 60×30 mm FOV, 1.5 mm slice thickness, 3,726 ms TR, 89 ms TE, 32 b-factors, no signal averaging). T2-weighted data and trace diffusion image data shown in C) and D) was obtained with 2D-FT imaging and LSDI at 4.7 Tesla (LSDI: 256×128 matrix interpolated to a 256×256 matrix, 40×40 mm FOV, 1.5 mm slice thickness. 4,266 ms TR, 36 ms TE, 32 b-factors, no signal averaging). A) On the T2-weighted LSDI image, the tumor area appears hyperintense (U-87 tumors are known to present insignificant edema). B) On the χ2 error parameter map, the tumor area also appears hyperintense (contrast ratio between tumor and normal tissue: 3.8). A second, smaller bright spot on the left side of the image, outside of the brain, is attributed to inflowing blood within a large vessel. C) A larger hyperintense area can be seen on the T2-weighted 2D-FT image (TR 2590 ms/TE 48 ms) of a later stage in a different animal. D) The same area appears also appears hyperintense on the corresponding χ2-map (tumor/normal tissue contrast ratio: 2.4).
Figure 8
Figure 8
Axial brain images of a 47 year old female patient with a right temporal low grade astrocytoma (grade I). A) The post-contrast T1-weighted spin-echo image (TR 650/TE 14) shows no enhancement at the location of the tumor. B) The T2-weighted spin-echo image (TR 3,450/TE 98) demonstrates the tumor lesion. C) On the χ2 error parameter map, similarly as on the T1-weighted image, the tumor appears isointense with the surrounding normal tissue. Artifactual high image intensities due to intermittent motion-related signal loss, however, are present in the orbital cavity. LSDI high-b scan parameters are the same as those presented in Fig. 2.
Figure 9
Figure 9
Axial brain images of a 49 year old male patient with an oligodendroglioma WHO grade II (see Case 1 in Table 3). A) T1-weighted post-contrast spin-echo image (TR 750 ms/TE 14 ms) shows a small enhancing lesion. B) The T2-weighted spin-echo image (TR 3,900 ms/TE 98 ms) presents a larger area of hyperintensity. C) On the χ2 error parameter map, the area of hyperintensity exceeds the area of enhancement apparent on the T1-weighted image. LSDI high-b scan parameters are the same as already presented in Fig. 2. D) FA map obtained with conventional LSDI tensor imaging shows extensive nerve fiber tract destruction within the area of hyperintensity documented on the T2-weighted image and the χ2 error parameter map. Evidently tumor growth extends beyond the area of enhancement visible on the T1-weighted image.
Figure 10
Figure 10
Coronal images of a giant cell astrocytoma with cyst formation in a 51 year old male patient. A) The LSDI FA map reveals a marked lateral shift of the corpus callosum and the cingulum tracts (arrows). B) ADC map showing an enlarged area with overlaid glyphs that represent the primary diffusion eigenvector scaled by the FA of the respective voxel. The in-plane component of the scaled primary diffusion eigenvector is depicted with short line segments and the out-of plane component by dots of different sizes. A widening, without apparent fiber destruction, of the left half of the corpus callosum can be discerned. In the immediate surrounding of the cyst, fiber structures appear to be intact, but severely distorted. The ADC value within the edematous part of the corpus callosum equals 1.18 µm2/ms and within the cystic lesion 2.82 µm2/ms.
Figure 11
Figure 11
Axial brain images of a 57 year old female patient with a multifocal glioblastoma. A) The T1-weighted post-contrast spin-echo image (TR 750 ms/TE 14 ms) shows two lesions, one of them with invasion into the splenium of the corpus callosum. B) Detail of FA map with three regions of interest (ROI) drawn in the splenium of the corpus callosum (FA values: red ROI 0.65, yellow ROI 0.46, green ROI 0.20). C) Same FA map as shown in B) with overlaid in-plane fiber tracking path, documenting the presence of intact fibers in the tumor-invaded splenium.
Figure 12
Figure 12
Axial brain images of a 57 year old male patient with lung tumor metastasis. A) The axial T1-weighted post-contrast spin-echo image (TR 700 ms/TE 14 ms) shows a small lesion with an enhancing rim within the internal capsule. B) On the ADC map elevated diffusion is evident within the tumor and surrounding edema. (tumor ADC: 1.11 µm2/ms; normal appearing white matter ADC: 0.71 µm2/ms). C) On the FA map the tumor lesion is clearly discerned as an area with low anisotropy (tumor FA: 0.08; contra-lateral side internal capsule FA: 0.47).

Similar articles

Cited by

References

    1. Tsuruda JS, Chew WM, Moseley ME, Norman D. Diffusion-weighted MR imaging of the brain: Value of differentiating between extraaxial cysts and epidermoid tumors. Am J Neuroradiol. 1990;11(5):925–931. - PMC - PubMed
    1. Essig M, Hawighorst H, Schoenberg SO, Engenhart-Cabillic R, Fuss M, Debus J, Zuna I, Knopp MV, van Kaick G. Fast fluid-attenuated inversion-recovery (FLAIR) MRI in the assessment of intraaxial brain tumors. J Magn Reson Imaging. 1998;8(4):789–798. - PubMed
    1. Cha S. Perfusion MR imaging of brain tumors. Top Magn Reson Imaging. 2004;15(5):279–289. Review. - PubMed
    1. Roberts HC, Roberts TP, Brasch RC, Dillon WP. Quantitative measurement of microvascular permeability in human brain tumors achieved using dynamic contrast-enhanced mr imaging: correlation with histologic grade. Am J Neuroradiol. 2000;21(5):891–899. - PMC - PubMed
    1. Sehgal V, Delproposto Z, Haddar D, Haacke EM, Sloan AE, Zamorano LJ, Barger G, Hu J, Xu Y, Prabhakaran KP, Elangovan IR, Neelavalli J, Reichenbach JR. Susceptibility-weighted imaging to visualize blood products and improve tumor contrast in the study of brain masses. J Magn Reson Imaging. 2006;24(1):41–51. - PubMed

Publication types

MeSH terms