. 2010 Oct 25;207(11):2439-53.
doi: 10.1084/jem.20100587. Epub 2010 Sep 27.

HIF-1α regulates function and differentiation of myeloid-derived suppressor cells in the tumor microenvironment

Affiliations

HIF-1α regulates function and differentiation of myeloid-derived suppressor cells in the tumor microenvironment

Cesar A Corzo et al. J Exp Med. .

Abstract

Myeloid-derived suppressor cells (MDSCs) are a major component of the immune-suppressive network described in cancer and many other pathological conditions. We demonstrate that although MDSCs from peripheral lymphoid organs and the tumor site share similar phenotype and morphology, these cells display profound functional differences. MDSC from peripheral lymphoid organs suppressed antigen-specific CD8(+) T cells but failed to inhibit nonspecific T cell function. In sharp contrast, tumor MDSC suppressed both antigen-specific and nonspecific T cell activity. The tumor microenvironment caused rapid and dramatic up-regulation of arginase I and inducible nitric oxide synthase in MDSC, which was accompanied by down-regulation of nicotinamide adenine dinucleotide phosphate-oxidase and reactive oxygen species in these cells. In contrast to MDSC from the spleen, MDSC from the tumor site rapidly differentiated into macrophages. Exposure of spleen MDSC to hypoxia resulted in the conversion of these cells to nonspecific suppressors and their preferential differentiation to macrophages. Hypoxia-inducible factor (HIF) 1α was found to be primarily responsible for the observed effects of the tumor microenvironment on MDSC differentiation and function. Thus, hypoxia via HIF-1α dramatically alters the function of MDSC in the tumor microenvironment and redirects their differentiation toward tumor-associated macrophages, hence providing a mechanistic link between different myeloid suppressive cells in the tumor microenvironment.


Figures
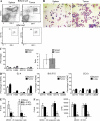
Figure 1.
Figure 1.
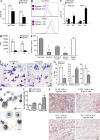
Phenotype and function of MDSC in tumor site. (A and B) 3 × 10⁵ EL-4 tumor cells were injected i.p. into C57BL/6 mice. After 3 wk, spleens and cells from tumor ascites were collected. Gr-1+CD11b+ MDSC were sorted (A) and their morphology was evaluated by staining with H&E (B; 200× magnification). Bars, 10 µm. (C, left) Surface markers in gated Gr-1+CD11b+ MDSC isolated from spleens and tumors of the same mice. (C, right) Ratio of granulocytic/monocytic MDSC. Five experiments were performed. Error bars show mean and SD. (D) Surface markers in gated Gr-1+CD11b+ MDSC isolated from spleens and solid tumors of the same mice. All tissues were subjected to the same enzymatic digestions. Three indicated tumor models were used. Each experiment included four mice. Mean ± SD is shown. (E and F) Gr-1+CD11b+ cells purified from spleens of tumor-free mice (naive) or spleens (SPL) and ascites (ASC) of EL-4 tumor-bearing mice were cultured at indicated ratios with 105 splenocytes from transgenic 2C mice. (E) Splenocytes were stimulated with control and specific peptides. IFN-γ production was measured in quadruplicates in ELISPOT assay. Number of spots per 105 2C splenocytes is shown. Values in cells stimulated with control peptide were subtracted. *, statistically significant (P < 0.05) difference from naive mice. A typical example of four independent experiments is shown. (F) Splenocytes were stimulated with anti-CD3/CD28 antibodies. In addition to the measurement of IFN-γ production, evaluation of splenocyte proliferation was performed using 3H-thymidine uptake. CPM, counts per minute. Thymidine uptake in cells stimulated with control peptide was <1,000 cpm. All experiments were performed in triplicates. A typical result of three performed experiments is shown. Error bars show mean and SD. *, statistically significant (P < 0.05) differences from naive mice.
Figure 2.
Figure 2.
Factors regulating MDSC suppressive activity. (A) Cells collected from the tumor site or spleens of EL-4 tumor-bearing mice were stimulated with PMA, labeled with 1 µM dichlorodihydrofluorescein diacetate (DCFDA), and stained with APC-conjugated anti–Gr-1 antibody and PerCP-conjugated anti-CD11b antibody. DCFDA fluorescence was measured in Gr-1+CD11b+ population by flow cytometry. Cumulative results from four independently performed experiments are shown. In all panels, * denotes statistically significant difference (P < 0.05) from naive mice. (B) RNA was extracted from Gr-1+CD11b+ cells isolated from spleens or tumor of the same mice and expression of gp91phox and p47phox was measured in quantitative real-time PCR (qRT-PCR). The experiment was performed in triplicates and repeated twice with the same result. (C) MDSCs from spleen and tumor ascites were stimulated with 30 ng/ml IFN-γ for 48 h and expression of inos was measured in qRT-PCR (left). The same cells were mixed at the indicated ratio with 2 × 10⁵ splenocytes stimulated with anti-CD3/CD28 antibodies. After a 48-h incubation, culture medium was collected and assayed for nitrites (right). Experiments were performed in triplicates and repeated three times with the same results. #, statistically significant (P < 0.05) differences between MDSC isolated from spleen and tumor at the same time point. (D) Arginase 1 gene expression (left) and enzymatic activity (right) were evaluated in MDSC from tumor site and spleen. All experiments were performed in triplicates and repeated three times with the same results. *, statistically significant differences (P < 0.05) from naive mice; #, statistically significant (P < 0.05) differences between ascites and spleen of the same mice. (E) Suppressive activity of MDSC from gp91phox knockout mice on IFN-γ production by transgenic 2C T cells after stimulation with either specific peptide (left) or anti-CD3/CD28 antibodies (right). Each experiment was performed in triplicates. Two experiments with the same results were performed. *, statistically significant differences (P < 0.05) from naive mice. (F) MDSCs isolated from spleens or tumor site were incubated at a 1:4 ratio with naive syngeneic splenocytes stimulated with anti-CD3/CD28 antibodies in the presence of iNOS (0.5 mM L-NNMA) and arginase (0.5 mM nor-NOHA) inhibitors. IFN-γ production was measured in ELISPOT assay and cell proliferation by incorporation of 3H-thymidine. Three experiments with the same results were performed. Error bars show mean and SD.
Figure 3.
Figure 3.
MDSC in peripheral blood and tumor tissues of cancer patients. (A–C) Peripheral blood and tumor tissues were collected from patients with HNC during surgical resection. Single cell suspensions were prepared as described in Materials and methods and cells were stained with anti-CD11b, anti-CD14, and anti-CD33 antibodies. (A) A typical example of gating of CD11b+CD14CD33+ MDSC from the same patient in flow cytometry. (B) Cells were stained with DCFDA to detect ROS level within the population of CD11b+CD14CD33+ cells from the same patient. Cumulative results from six patients are shown. **, statistically significant difference between MDSC in the tumor site and peripheral blood (P = 0.007). MFI, mean fluorescence intensity. (C) Cells were labeled with anti-iNOS antibody and the protein level was measured within the population of CD11b+CD14CD33+ cells. Cumulative results from six patients are shown. *, statistically significant difference between MDSC in the tumor site and peripheral blood (P = 0.04). (D) Proliferation of PHA-stimulated mononuclear cells in the presence of MDSC isolated from tumor and peripheral blood of the same patient. PBMCs (105/well) were stimulated with 5 µg/ml PHA in the presence of indicated amount of MDSC. Proliferation was measured in triplicate on day 3 by uptake of 3H-thymidine. Proliferation of PBMC in the absence of MDSC was considered 100%. ***, statistically significant difference between groups (P = 0.0008). Samples from three patients were tested and cumulative results are shown. Error bars show mean and SD.
Figure 4.
Figure 4.
Effect of the tumor microenvironment on MDSC function and differentiation. MDSC isolated from spleens of congenic CD45.1+ mice bearing 3 wk s.c. EL-4 tumors were transferred into ascites of CD45.2+ EL-4 tumor-bearing recipients. CD45.1+ donor cells were recovered using magnetic beads 4 h after cell transfer. For controls, CD45.1+ MDSC were transferred i.v. into EL-4 tumor-bearing recipients or naive recipients and recovered from spleens 4 h after cell transfer. (A) After adoptive transfer, CD45.1+ MDSCs were cultured with 2C spleen responder cells (Resp.; 1:4 ratio) stimulated with control and specific peptides. IFN-γ production was measured by ELISPOT assay. The number of spots per 105 splenocytes is shown. Values in cells stimulated with control peptide were subtracted. Each experiment was performed in triplicates and repeated twice. *, statistically significant differences (P < 0.05) from the values in splenocytes cultured alone. Error bars show mean and SD. (B) Similar experiments performed using stimulation with anti-CD3/CD28 antibodies. Error bars show mean and SD. (C) Evaluation of gene expression of argI, iNOS, and p47phox in MDSC postadoptive transfer. Each experiment was performed in triplicates and repeated twice with the same results. Error bars show mean and SD. (D and E) Differentiation of MDSC at different time points after transfer. *, statistically significant (P < 0.05) differences between spleens and ascites. (D) The percentage of Gr-1+CD11b+ MDSC among all CD45.1+ donor cells. Before, the phenotype of MDSC before transfer to the mice. Error bars show mean and SD. (E) The percentage of mature macrophages (F4/80+CD11b+Gr-1) and DCs (CD11c+CD11b+Gr-1) among CD45.1+ donor cells. Mean ± SD from three experiments is shown. In D and E, * denotes statistically significant (P < 0.05) differences between the proportion of cells in spleens and tumors at the same time point. (F) Differentiation of MDSC in tumor-free peritoneum. Congenic CD45.1+ mice were injected i.p. with 1 ml thioglycollate. 3 d later, 5 × 10⁶ MDSCs isolated from spleen of EL-4 tumor-bearing C57BL/6 (CD45.2+) mice were injected i.p. Cells were collected 18 h after the injection and the proportion of different myeloid cells was measured within the gated population of CD45.2+ donor cells by flow cytometry. Two independent experiments were performed. Error bars show mean and SD.
Figure 5.
Figure 5.
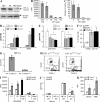
Regulation of MDSC function by hypoxia. MDSCs were isolated from spleens of CT26 tumor-bearing mice and cultured in medium containing 10 ng/ml GM-CSF and 25% CT26 tumor cell conditioned medium (TCCM) under normoxic and hypoxic (1% O2) conditions using a hypoxic chamber. (A) Expression of NOX subunits was evaluated in triplicates after 2 d of culture using qRT-PCR. Results are shown as mean ± SD from three experiments performed with similar results. *, statistically significant (P < 0.05) differences between normoxia and hypoxia groups. (B) Cells were collected after 3 d of culture, loaded with DCFDA, and labeled with anti–Gr-1 and anti–CD11b antibodies. Fluorescence intensity of DCFDA was measured within the Gr-1+CD11b+ population. A typical result of three independently performed experiments is shown. (C) Expression of argI and inos was evaluated in triplicates in MDSC after 24- and 48-h incubations in hypoxic and normoxic conditions using qRT-PCR. Results from three independently performed experiments are shown. *, statistically significant (P < 0.05) differences between normoxia and hypoxia groups. (D) MDSCs were cultured for 48 h under normoxic or hypoxic conditions and their ability to suppress proliferation of anti-CD3/CD28–stimulated splenocytes was evaluated. Cell proliferation was measured in triplicates by 3H-thymidine uptake. A typical result from two performed experiments is shown. (E) BM cells were cultured for 3 d in media containing 10 ng/ml GM-CSF and 25% TCCM. After that time, cells were incubated under normoxic or hypoxic conditions for an additional 2 d. Gr-1+ cells were isolated and cultured with splenocytes from BALB/c mice stimulated with anti-CD3/CD28 antibodies. Production of IFN-γ was measured in triplicates by ELISPOT assay. *, statistically significant (P < 0.05) differences from values of splenocytes cultured alone. Two independent experiments were performed. (F) MDSCs were cultured for 5 d with 10 ng/ml GM-CSF and 25% TCCM in normoxia or hypoxia and then fixed and stained with H&E (400× magnification). Bars, 10 µm. A typical example of two independently performed experiments is shown. (G) Phenotype of MDSC cultured for 5 d in hypoxia or normoxia. The proportions of cells with indicated phenotype were evaluated by flow cytometry. Cumulative results of four performed experiments are shown. *, statistical significant differences (P < 0.05) between the groups. Error bars in A, C–E, and G show mean and SD. (H) Cells derived from a 5-d culture of MDSC in hypoxia were tested for nonspecific esterase activity. Assay was repeated using cells isolated from two independent experiments. Bars, 10 µm. (I and J) An association between the presence of MΦ and MDSC in hypoxic areas of the tumor. (I) Number of Gr-1+ or F4/80+ cells per one 800-µm-×-600-µm field. A total of 8–16 fields was counted for each area and results are shown as mean ± SD. *, statistically significant (P < 0.05) differences between areas with less and more hypoxia. (J) Representative areas of s.c. EL-4 tumors are shown. Brown, staining with antibody detecting area of hypoxia; red; F4/80+ or Gr-1+ cells. Bars, 100 µm.
Figure 6.
Figure 6.
HIF-1α regulation of MDSC function. (A) MDSCs isolated from spleens of EL-4 tumor-bearing mice were cultured with 10 ng/ml GM-CSF in hypoxia for 4 or 16 h. The level of HIF1-α was measured by Western blotting. A typical example of three independently performed experiments is shown. (B–F) MDSCs were treated with various concentrations of HIF-1α stabilizer DFO in the presence of 10 ng/ml GM-CSF for 48 h and then washed and used in the experiments. No effect of DFO on MDSC cell viability was observed (not depicted). Each experiment was performed in triplicates and repeated two times with the same result. Results are shown as mean ± SD. (B and C) Effect of MDSC on proliferation (B) and IFN-γ production (C) of splenocytes stimulated with anti-CD3/CD28 antibodies. (D and E) Effect of a 48-h treatment of MDSC with DFO on the expression of arg1, inos, gp91phox, and p47phox. Each experiment was performed in triplicates. Three experiments were performed with the same result. (F) Percentage of F4/80+CD11b+ MΦ differentiated from MDSC treated with DFO for 5 d. Cumulative results (mean ± SD) of three experiments are shown. In D and F, * denotes statistically significant (P < 0.05) differences from untreated (0 µM) samples. (G) Evaluation of BM reconstitution by BM cells from HIF-1α–deficient mice. Expression is shown of hif-1α in HIF-1αfl/flCre+/− and HIF-1αfl/flCre−/− mice after treatment with poly I:C using real-time PCR. Experiments were performed in triplicates in three mice. Error bars show mean and SD. (H) Reconstitution of lethally irradiated CD45.1+ congenic mice with CD45.2+ BM from HIF-1α–deficient (HIF-1αflox/flox, Cre+/−) or WT (HIF-1α flox/flox, Cre−/−) mice. Blood of mice 2 wk after BM transfer was tested. A typical example of three experiments is shown. (I–K) CD45.1+ lethally irradiated recipients were reconstituted with BM cells from HIF-1α knockout (KO) or WT CD45.2+ mice. 2 wk later, mice were inoculated s.c. with 5 × 10⁵ EL-4 tumor cells. 3 wk after that, CD45.2+ HIF-1α WT or KO MDSC were isolated from spleens of tumor-bearing mice and then transferred into ascites of congenic CD45.1+ mice. 12 h later, CD45.2+ CD11b+ donor cells were isolated and used in the subsequent experiments. (I) The MDSCs were cultured with anti-CD3/CD28 antibody-activated T cells (Resp., responder cells) and their proliferation was measured by 3H-thymidine incorporation. Experiments were performed in triplicates. Mean ± SD is shown. Experiments were performed twice with the same result. (J) Expression of arg1 and inos was analyzed in the MDSC before and after adoptive transfer into the tumor milieu. Two independent experiments were performed in triplicates. In J and K, * denotes statistically significant (P < 0.05) differences between the groups. Error bars show mean and SD. (K) ROS level in MDSC after the adoptive transfer was determined with DCFDA. Cumulative results of two experiments are shown. Error bars show mean and SD.
Figure 7.
Figure 7.
Changes in MDSC function and differentiation induced by the tumor-microenvironment require HIF-1α. (A) Percentage of MΦ and DCs in the population of CD11b+Gr-1CD45.2+ donor cells 18 h after the adoptive transfer of HIF-1α+/+ and HIF-1α−/− MDSC into ascites tumors of congeneic recipients. Each experiment included two mice per group and was performed twice. *, statistically significant (P < 0.05) differences between groups. (B and C) HIF-1α–deficient and WT MDSCs were generated in vivo by transfer of BM cells into tumor-bearing recipients as described in A. MDSCs were isolated and cultured with GM-CSF for 5 d under hypoxic or normoxic conditions. Error bars show mean and SD. (B) Expression of arg1 and inos was measured in triplicates in RT-PCR. Two independent experiments with the same results were performed. Error bars show mean and SD. (C) The phenotype of cells differentiated from MDSC after a 5-d culture with GM-CSF. Two independent experiments with the same results were performed. (D) Tumor growth of lethally irradiated mice reconstituted with either WT or HIV-1α–deficient BM. Tumor was established by s.c. inoculation of 3 × 10⁵ B16.F10 tumor cells 2 wk after transfer of BM to lethally irradiated recipients. Two groups of mice (control) were left untreated. Mice from two other groups received 3 × 10⁶ splenocytes from Pmel-1 T cell receptor transgenic mice on day 6 after tumor inoculation. 1 d later, the mice were immunized with specific peptide. Tumor growth was monitored every 3–4 d in individually tagged mice by measuring two opposing diameters with a set of calipers. Each group included four to five mice. Results of individual mice are shown.

Similar articles

Cited by

References

    1. Albina J.E., Reichner J.S. 2003. Oxygen and the regulation of gene expression in wounds. Wound Repair Regen. 11:445–451 10.1046/j.1524-475X.2003.11619.x - DOI - PubMed
    1. Almand B., Clark J.I., Nikitina E., van Beynen J., English N.R., Knight S.C., Carbone D.P., Gabrilovich D.I. 2001. Increased production of immature myeloid cells in cancer patients: a mechanism of immunosuppression in cancer. J. Immunol. 166:678–689 - PubMed
    1. Bronte V., Zanovello P. 2005. Regulation of immune responses by L-arginine metabolism. Nat. Rev. Immunol. 5:641–654 10.1038/nri1668 - DOI - PubMed
    1. Cheng P., Corzo C.A., Luetteke N., Yu B., Nagaraj S., Bui M.M., Ortiz M., Nacken W., Sorg C., Vogl T., et al. 2008. Inhibition of dendritic cell differentiation and accumulation of myeloid-derived suppressor cells in cancer is regulated by S100A9 protein. J. Exp. Med. 205:2235–2249 10.1084/jem.20080132 - DOI - PMC - PubMed
    1. Corzo C.A., Cotter M.J., Cheng P., Cheng F., Kusmartsev S., Sotomayor E., Padhya T., McCaffrey T.V., McCaffrey J.C., Gabrilovich D.I. 2009. Mechanism regulating reactive oxygen species in tumor-induced myeloid-derived suppressor cells. J. Immunol. 182:5693–5701 10.4049/jimmunol.0900092 - DOI - PMC - PubMed

Publication types

MeSH terms