. 2010 Oct 12;107(41):17821-6.
doi: 10.1073/pnas.1005366107. Epub 2010 Sep 27.

FERONIA receptor-like kinase regulates RHO GTPase signaling of root hair development

Affiliations

FERONIA receptor-like kinase regulates RHO GTPase signaling of root hair development

Qiaohong Duan et al. Proc Natl Acad Sci U S A. .

Abstract

Plant RHO GTPases (RAC/ROPs) mediate multiple extracellular signals ranging from hormone to stress and regulate diverse cellular processes important for polarized cell growth, differentiation, development, reproduction, and responses to the environment. They shuttle between the GDP-bound inactive state and the GTP-bound activated state and their activation is predominantly mediated by a family of guanine nucleotide exchange factors (GEFs) referred to as ROPGEFs. Using the Arabidopsis ROPGEF1 as bait, we identified members of a receptor-like kinase (RLK) family as potential upstream regulators for RAC/ROP signaling. NADPH oxidase-derived reactive oxygen species (ROS) are emerging as important regulators for growth and development and play a crucial role in mediating RAC/ROP-regulated root hair development, a polarized cell growth process. We therefore screened T-DNA insertion mutants in these RLKs for root hair defects and found that mutations in one of them, At3g51550 encoding the FERONIA (FER) receptor-like kinase, induced severe root hair defects. We show that the fer phenotypes correlated with reduced levels of active RAC/ROPs and NADPH oxidase-dependent, auxin-regulated ROS accumulation in roots and root hairs and that up-regulating RAC/ROP signaling in fer countered the mutant phenotypes. Taken together, these observations strongly support FER as an upstream regulator for the RAC/ROP-signaled pathway that controls ROS-mediated root hair development. Moreover, FER was pulled down by ROP2 GTPase in a guanine nucleotide-regulated manner implying a dynamic signaling complex involving FER, a ROPGEF, and a RAC/ROP.


Conflict of interest statement

The authors declare no conflict of interest.

Figures

Fig. 1.
Fig. 1.
FER is a broadly expressed ROPGEF-interacting RLK. (A) The kinase domain of FER [FER(K)] and ROPGEF1 (GEF1) interact in yeast two-hybrid assays, complementing histidine deficiency (First and Third rows). FER(K) interacts with several other GEFs and ROPGEF1 interacts with RAC/ROP (Fig. S1 B and C) (19, 20). (B) FER and ROPGEF1 interact in BiFC assays in protoplasts. YFP image for the interacting YN–EE–GEF1 and FER–HA–YC was acquired by autoexposure (Top); the same exposure condition was used for control protoplasts expressing one of the partners (Middle and Bottom). (Scale bar, 10 μm.) (C) pFER::GUS expression pattern in 10-d-old seedlings and roots and leaf from 10-d-old plants. Arrowheads, root hairs. [Scale bars, 1 mm (seedling and inflorescence), 50 μm (root and stigma), and 500 μm (leaf).] (D) FER–GFP localization in pFER::FER-GFP transformed Arabidopsis. [Scale bars, 100 μm (root), 50 μm (trichome), and 10 μm (root, leaf epidermis, and root hairs).]
Fig. 2.
Fig. 2.
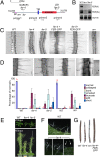
Mutations in FER induce root hair and other vegetative phenotypes. (A) Domain map for FER. Locations of the T-DNA insertion alleles fer-4 (GABI_GK106A06) and fer-5 (Salk_ 029056c), fer, and srn (–33) and primers used in PCR analyses are indicated. SP, signal peptide; TM, transmembrane domain; UTR, untranslated region. Mature FER is ∼807 aa long. Genomic DNA analysis for fer-4 and fer-5 is shown in Fig. S2A. (B) RT-PCR analysis for FER expression. FER(K), PCR used primers 3 and 4; FER(Ex), PCR used primers 1 and 2. (C) Root hairs from 4-d-old wild-type (WT), fer-4, fer-5 and srn, and pFER::FER-GFP complemented fer-4, -5 seedlings. (Scale bar, 100 μm.) See Fig. S2B for FER–GFP expression in the complemented fer seedlings. (D) fer mutations induce a broad spectrum of root hair defects. Top shows normal root hairs (Left) and fer mutation-induced collapsed (the most severe), burst [seen with discharged cytoplasm (arrowhead)], arrested, truncated, split, and short (the least severe) root hairs. (Scale bar, 100 μm.) The histogram shows distribution of the different classes of root hairs in WT and mutant seedlings. Each data bar represents the mean ± SD where n = 1,200 root hairs from 15–24 four-day-old seedlings. Δs highlight normal root hairs from each sample. (E) fer-induced growth suppression. (Scale bars, 10 mm (25 d) and 50 mm (45 d.) (F) fer-4 induces trichome defects. Arrows, collapsed; arrowheads, more than three branches. Approximately 30% of trichomes in fer-4 seedlings were normal compared with >90% in WT (Fig. S2C). (G) fer-4 and srn show similar reproductive phenotype. (Scale bar, 2 mm.)
Fig. 3.
Fig. 3.
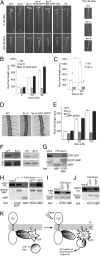
fer mutants show reduced auxin and RAC/ROP signaling capacity. (A) Four-day-old WT, mutant, and pFER::FER-GFP complemented mutant seedlings grown under standard (0 nM NAA) or auxin-supplemented conditions. Auxin-treated WT and fer-4, -5 mutants are shown magnified on the Right. (Scale bar, 2 mm.) (B) Root hair length comparison between WT, fer-5, and complemented fer-5 under standard and auxin-supplement growth conditions. Data bars represent average of the mean root hair lengths from triplicate samples ± SE. For each replicate, 300 root hairs from at least nine plants were measured. (C) Root hair length comparison between WT and fer-4 (Fig. S2D shows data for srn). (D and E) Overexpression of GFP–ROP2 rescued fer-5–induced root hair morphological defects (D), restored root hair elongation (E, compare white and black bars), and auxin-stimulated root hair elongation (E, compare 0, 50, and 100 nM NAA data bars). See Fig. S3 for genotyping of these rescued plants. (Scale bar, 100 μm.) (F) Pulldown of active RAC/ROPs. ICR1–MBP was used for fer-4; PBD–GST (8, 9) was used for fer-5. Anti-NtRac1 antibody (9) was used for detection. The fer-4 blot was visualized by chemiluminescence, the fer-5 blot by alkaline phosphatase reaction. Quantification of data is shown in Fig. S2E. (GJ) ROP2–MBP pulldown of pFER-expressed FER–GFP from microsomal proteins from transformed seedlings (G), of FER–HA expressed in transiently transfected mesophyll (H) and root (I) protoplasts, and of GEF4–HA expressed in mesophyll protoplasts (J). Lower panels show input bait proteins on Ponçeau-stained blots. Anti-GFP (G) and anti-HA (HJ) were used for detection. *band in G was unrelated to the experiment. (K) Sketch showing guanine nucleotide-regulated FER–RAC/ROP interaction as suggested by results shown in GJ. Presumably, in vivo, signal activation-induced changes in the interacting ROPGEF and RAC/ROP would weaken the GEF–RAC/ROP interaction, recycling the ROPGEF, and releasing activated RAC/ROP to interact with effectors for downstream signaling. Data for WT, fer-5, fer5 + FERGFP and fer5 + GFPROP2 shown in B and E were collected in the same experiments thus the data for WT and fer-5 are used in both panels. Mutant root hair data are overestimations because only hairs with measurable lengths were included in the data set. Brackets and the numbers 1 and 2 in C denote statistical comparisons (1, significant; 2, insignificant) as described in Materials and Methods; these differences are representative for data shown in B and E.
Fig. 4.
Fig. 4.
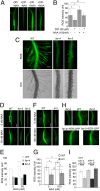
FER regulates NADPH dependent- and auxin-regulated ROS production in root and root hairs. (A and B) ROS accumulation and auxin-stimulated ROS production in Arabidopsis primary root. DPI inhibition reflects NADPH oxidase-dependent ROS production (see e.g., refs. 16, 17, 41). Seedlings were treated with H2DCF–DA to monitor ROS levels (see SI Materials and Methods). The rectangle in A indicates a representative region of interest (ROI) where average root ROS intensity was quantified for this and other samples; comparative data are shown in B. All images were acquired using the control (−DPI, −NAA) image acquisition condition. Each data bar in the histogram represents the mean ± SD of ROS intensity measured from nine roots in one representative experiment. All other experiments involving root ROS intensity comparison (DI; Fig. 5) follow the same sampling and analysis methods. (C) ROS in WT, fer-4 and fer-5 root and root hairs. The WT ROS image was acquired by autoexposure; all other images were acquired using the WT exposure conditions. (Scale bar, 100 μm.) (DI) ROS in the primary roots of WT, fer-4, -5 (D and E), srn (F and G), and pFER::FER-GFP complemented fer-4, -5 seedlings [H and I; under the ROS imaging conditions, FER–GFP signal was negligible (see Fig. S5B)] in normal and auxin-treated growth conditions. (E, G, and I) ROS level quantification at representative ROIs. (Scale bars, 100 μm.) 1, significant; 2, insignificant differences. Statistical differences shown in G are representative for data shown in E and I, except for fer-5’s weak but significant response to NAA (E, P = 0.002376), reflecting its weaker phenotype.
Fig. 5.
Fig. 5.
FER and RAC/ROPs function in a common pathway regulating ROS production. (A and B) GFP–ROP2 restores ROS accumulation in fer-5 roots and root hairs. Image acquisition and quantitative analyses were as described in Fig. 4. ROS images (A) were acquired using exposure conditions for a H2DCF–DA-treated WT control under which GFP–ROP2 signal was negligible (fourth data bar in B; see also Fig. S5B). (Scale bar, 200 μm.) Note also the root hairs in the GFP–ROP2-expressing fer-4 seedlings. (B) Quantified comparative ROS levels. Root hair ROS was also quantified using dihydroethidium for detection (54) (Fig. S6 A and B). (C and D) Overexpression of CaMV35S-driven FER–HA (Fig.S6C), ROPGEF1 or NtRAC1(CA) (9) augments ROS production in roots and root hairs. Insets in C show DIC images. Quantified comparative ROS levels are shown in D. These transgenic plants did not show readily noticeable phenotypes other than mild root hair depolarization (e.g., as seen in GEF1ox seedling shown here), reflecting increased Rac/Rop signaling; their root hair lengths were within the range seen in control seedlings. (Scale bar in C, 200 μm.) 1, significant; 2, insignificant differences.

Comment in

Similar articles

Cited by

References

    1. Etienne-Manneville S, Hall A. Rho GTPases in cell biology. Nature. 2002;420:629–635. - PubMed
    1. Nibau C, Wu H-M, Cheung AY. RAC/ROP GTPases: ‘Hubs’ for signal integration and diversification in plants. Trends Plant Sci. 2006;11:309–315. - PubMed
    1. Yang Z, Fu Y. ROP/RAC GTPase signaling. Curr Opin Plant Biol. 2007;10:490–494. - PMC - PubMed
    1. Kost B. Spatial control of Rho (Rac-Rop) signaling in tip-growing plant cells. Trends Cell Biol. 2008;18:119–127. - PubMed
    1. Lavy M, et al. A Novel ROP/RAC effector links cell polarity, root-meristem maintenance, and vesicle trafficking. Curr Biol. 2007;17:947–952. - PubMed

Publication types

MeSH terms

LinkOut - more resources