Novel synthetic small-molecule activators of AMPK as enhancers of autophagy and amyloid-β peptide degradation
- PMID: 20852062
- PMCID: PMC3005419
- DOI: 10.1096/fj.10-167361
Novel synthetic small-molecule activators of AMPK as enhancers of autophagy and amyloid-β peptide degradation
Abstract
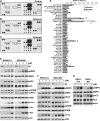
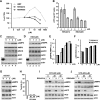
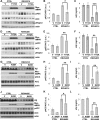
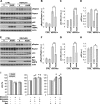
AMP-activated protein kinase (AMPK) is a metabolic sensor involved in intracellular energy metabolism through the control of several homeostatic mechanisms, which include autophagy and protein degradation. Recently, we reported that AMPK activation by resveratrol promotes autophagy-dependent degradation of the amyloid-β (Aβ) peptides, the core components of the cerebral senile plaques in Alzheimer's disease. To identify more potent enhancers of Aβ degradation, we screened a library of synthetic small molecules selected for their structural similarities with resveratrol. Here, we report the identification of a series of structurally related molecules, the RSVA series, which inhibited Aβ accumulation in cell lines nearly 40 times more potently than did resveratrol. Two of these molecules, RSVA314 and RSVA405, were further characterized and were found to facilitate CaMKKβ-dependent activation of AMPK, to inhibit mTOR (mammalian target of rapamycin), and to promote autophagy to increase Aβ degradation by the lysosomal system (apparent EC(50) ∼ 1 μM). This work identifies the RSVA compounds as promising lead molecules for the development of a new class of AMPK activating drugs controlling mTOR signaling, autophagy, and Aβ clearance.
Figures


Similar articles
-
Small-molecule activators of AMP-activated protein kinase (AMPK), RSVA314 and RSVA405, inhibit adipogenesis.Mol Med. 2011 Sep-Oct;17(9-10):1022-30. doi: 10.2119/molmed.2011.00163. Epub 2011 Jun 1. Mol Med. 2011. PMID: 21647536 Free PMC article.
-
AMP-activated protein kinase signaling activation by resveratrol modulates amyloid-beta peptide metabolism.J Biol Chem. 2010 Mar 19;285(12):9100-13. doi: 10.1074/jbc.M109.060061. Epub 2010 Jan 14. J Biol Chem. 2010. PMID: 20080969 Free PMC article.
-
Crocetin promotes clearance of amyloid-β by inducing autophagy via the STK11/LKB1-mediated AMPK pathway.Autophagy. 2021 Nov;17(11):3813-3832. doi: 10.1080/15548627.2021.1872187. Epub 2021 Jan 19. Autophagy. 2021. PMID: 33404280 Free PMC article.
-
Roles of AMP-activated protein kinase in Alzheimer's disease.Neuromolecular Med. 2012 Mar;14(1):1-14. doi: 10.1007/s12017-012-8173-2. Epub 2012 Feb 26. Neuromolecular Med. 2012. PMID: 22367557 Review.
-
Autophagic dysfunction in Alzheimer's disease: Cellular and molecular mechanistic approaches to halt Alzheimer's pathogenesis.J Cell Physiol. 2019 Jun;234(6):8094-8112. doi: 10.1002/jcp.27588. Epub 2018 Oct 26. J Cell Physiol. 2019. PMID: 30362531 Review.
Cited by
-
Prion Protein in Stem Cells: A Lipid Raft Component Involved in the Cellular Differentiation Process.Int J Mol Sci. 2020 Jun 11;21(11):4168. doi: 10.3390/ijms21114168. Int J Mol Sci. 2020. PMID: 32545192 Free PMC article. Review.
-
Autophagy and neurodegeneration.J Clin Invest. 2015 Jan;125(1):65-74. doi: 10.1172/JCI73944. Epub 2015 Jan 2. J Clin Invest. 2015. PMID: 25654552 Free PMC article. Review.
-
Targeting Mitochondria in Alzheimer Disease: Rationale and Perspectives.CNS Drugs. 2019 Oct;33(10):957-969. doi: 10.1007/s40263-019-00658-8. CNS Drugs. 2019. PMID: 31410665 Free PMC article. Review.
-
Peripheral Pathways to Neurovascular Unit Dysfunction, Cognitive Impairment, and Alzheimer's Disease.Front Aging Neurosci. 2022 Apr 18;14:858429. doi: 10.3389/fnagi.2022.858429. eCollection 2022. Front Aging Neurosci. 2022. PMID: 35517047 Free PMC article. Review.
-
Targeting the proteostasis network in Huntington's disease.Ageing Res Rev. 2019 Jan;49:92-103. doi: 10.1016/j.arr.2018.11.006. Epub 2018 Nov 28. Ageing Res Rev. 2019. PMID: 30502498 Free PMC article. Review.
References
-
- Selkoe D. J. (2001) Alzheimer's disease: genes, proteins, and therapy. Physiol. Rev. 81, 741–66 - PubMed
-
- Querfurth H. W., LaFerla F. M. (2010) Alzheimer's disease. N. Engl. J. Med. 362, 329–344 - PubMed
-
- Marambaud P., Robakis N. K. (2005) Genetic and molecular aspects of alzheimer's disease shed light on new mechanisms of transcriptional regulation. Genes Brain Behav. 4, 134–146 - PubMed
-
- Wilquet V., De Strooper B. (2004) Amyloid-beta precursor protein processing in neurodegeneration. Curr. Opin. Neurobiol. 14, 582–588 - PubMed
-
- Checler F. (1995) Processing of the beta-amyloid precursor protein and its regulation in alzheimer's disease. J. Neurochem. 65, 1431–1444 - PubMed
Publication types
MeSH terms
Substances
Grants and funding
LinkOut - more resources
Full Text Sources
Other Literature Sources
Miscellaneous

